Ethereum’s Bullish Emoji: A Signal to Investors to Prepare for Profits?

Journalist
- The price of Ethereum has fallen by more than 7% in the last seven days.
- Most metrics and market indicators pointed to a trend reversal.
The end of May was an uptrend for Ethereum [ETH] as the token’s daily chart showed a massive green candle. But the last week was not in investors’ interest as the token fell significantly.
However, the falling price trend may soon change, which could allow ETH to retest its March highs.
Ethereum is exhibiting an uptrend pattern
The latest data showed that the price of Ethereum has fallen by more than 7% in the last seven days. At the time of writing, ETH was trading at $3,516.89, with a market cap of over $422 billion.
Investors should not be discouraged as an uptrend pattern was emerging on the token’s daily chart. AskFX has observed that the price of ETH has consolidated within a bullish flag pattern.
The token entered the pattern after hitting its high in May. At press time, the price of the token was testing support near the lower boundary of the bullish flag pattern.
A successful test could initiate a bull rally. If that happens, it would be surprising to see Ethereum retest its March highs of $4,000 in the coming weeks.
TradingView
Does ETH intend to test the pattern or not?
To test the bullish pattern, ETH needs to have some green candles in the next few days. AskFX examined the data from CryptoQuant to see if that is possible.
According to our analysis, ETH’s exchange reserve decreased, suggesting that there was high buying pressure for the token. The total number of coins has also increased by 13.93% in the last 24 hours. This can be interpreted as a bullish sign.
The derivatives market also looked positive as ETH’s funding rates increased. The traders with long positions are in a dominant position and are willing to pay for the traders with short positions.
AskFX analyzed Glassnode data and found that ETH’s NVT ratio dropped last week. When the metric falls, it indicates that an asset has been undervalued. This usually leads to a price increase.
Source: Glassnode
Ethereum’s price touched the lower boundary of the Bollinger Bands, indicating a recovery. Moreover, its Relative Strength Index (RSI) also recorded an uptrend and moved towards the neutral mark.
Nevertheless, the MACD showed a bearish edge in the market, which could affect ETH’s recovery.
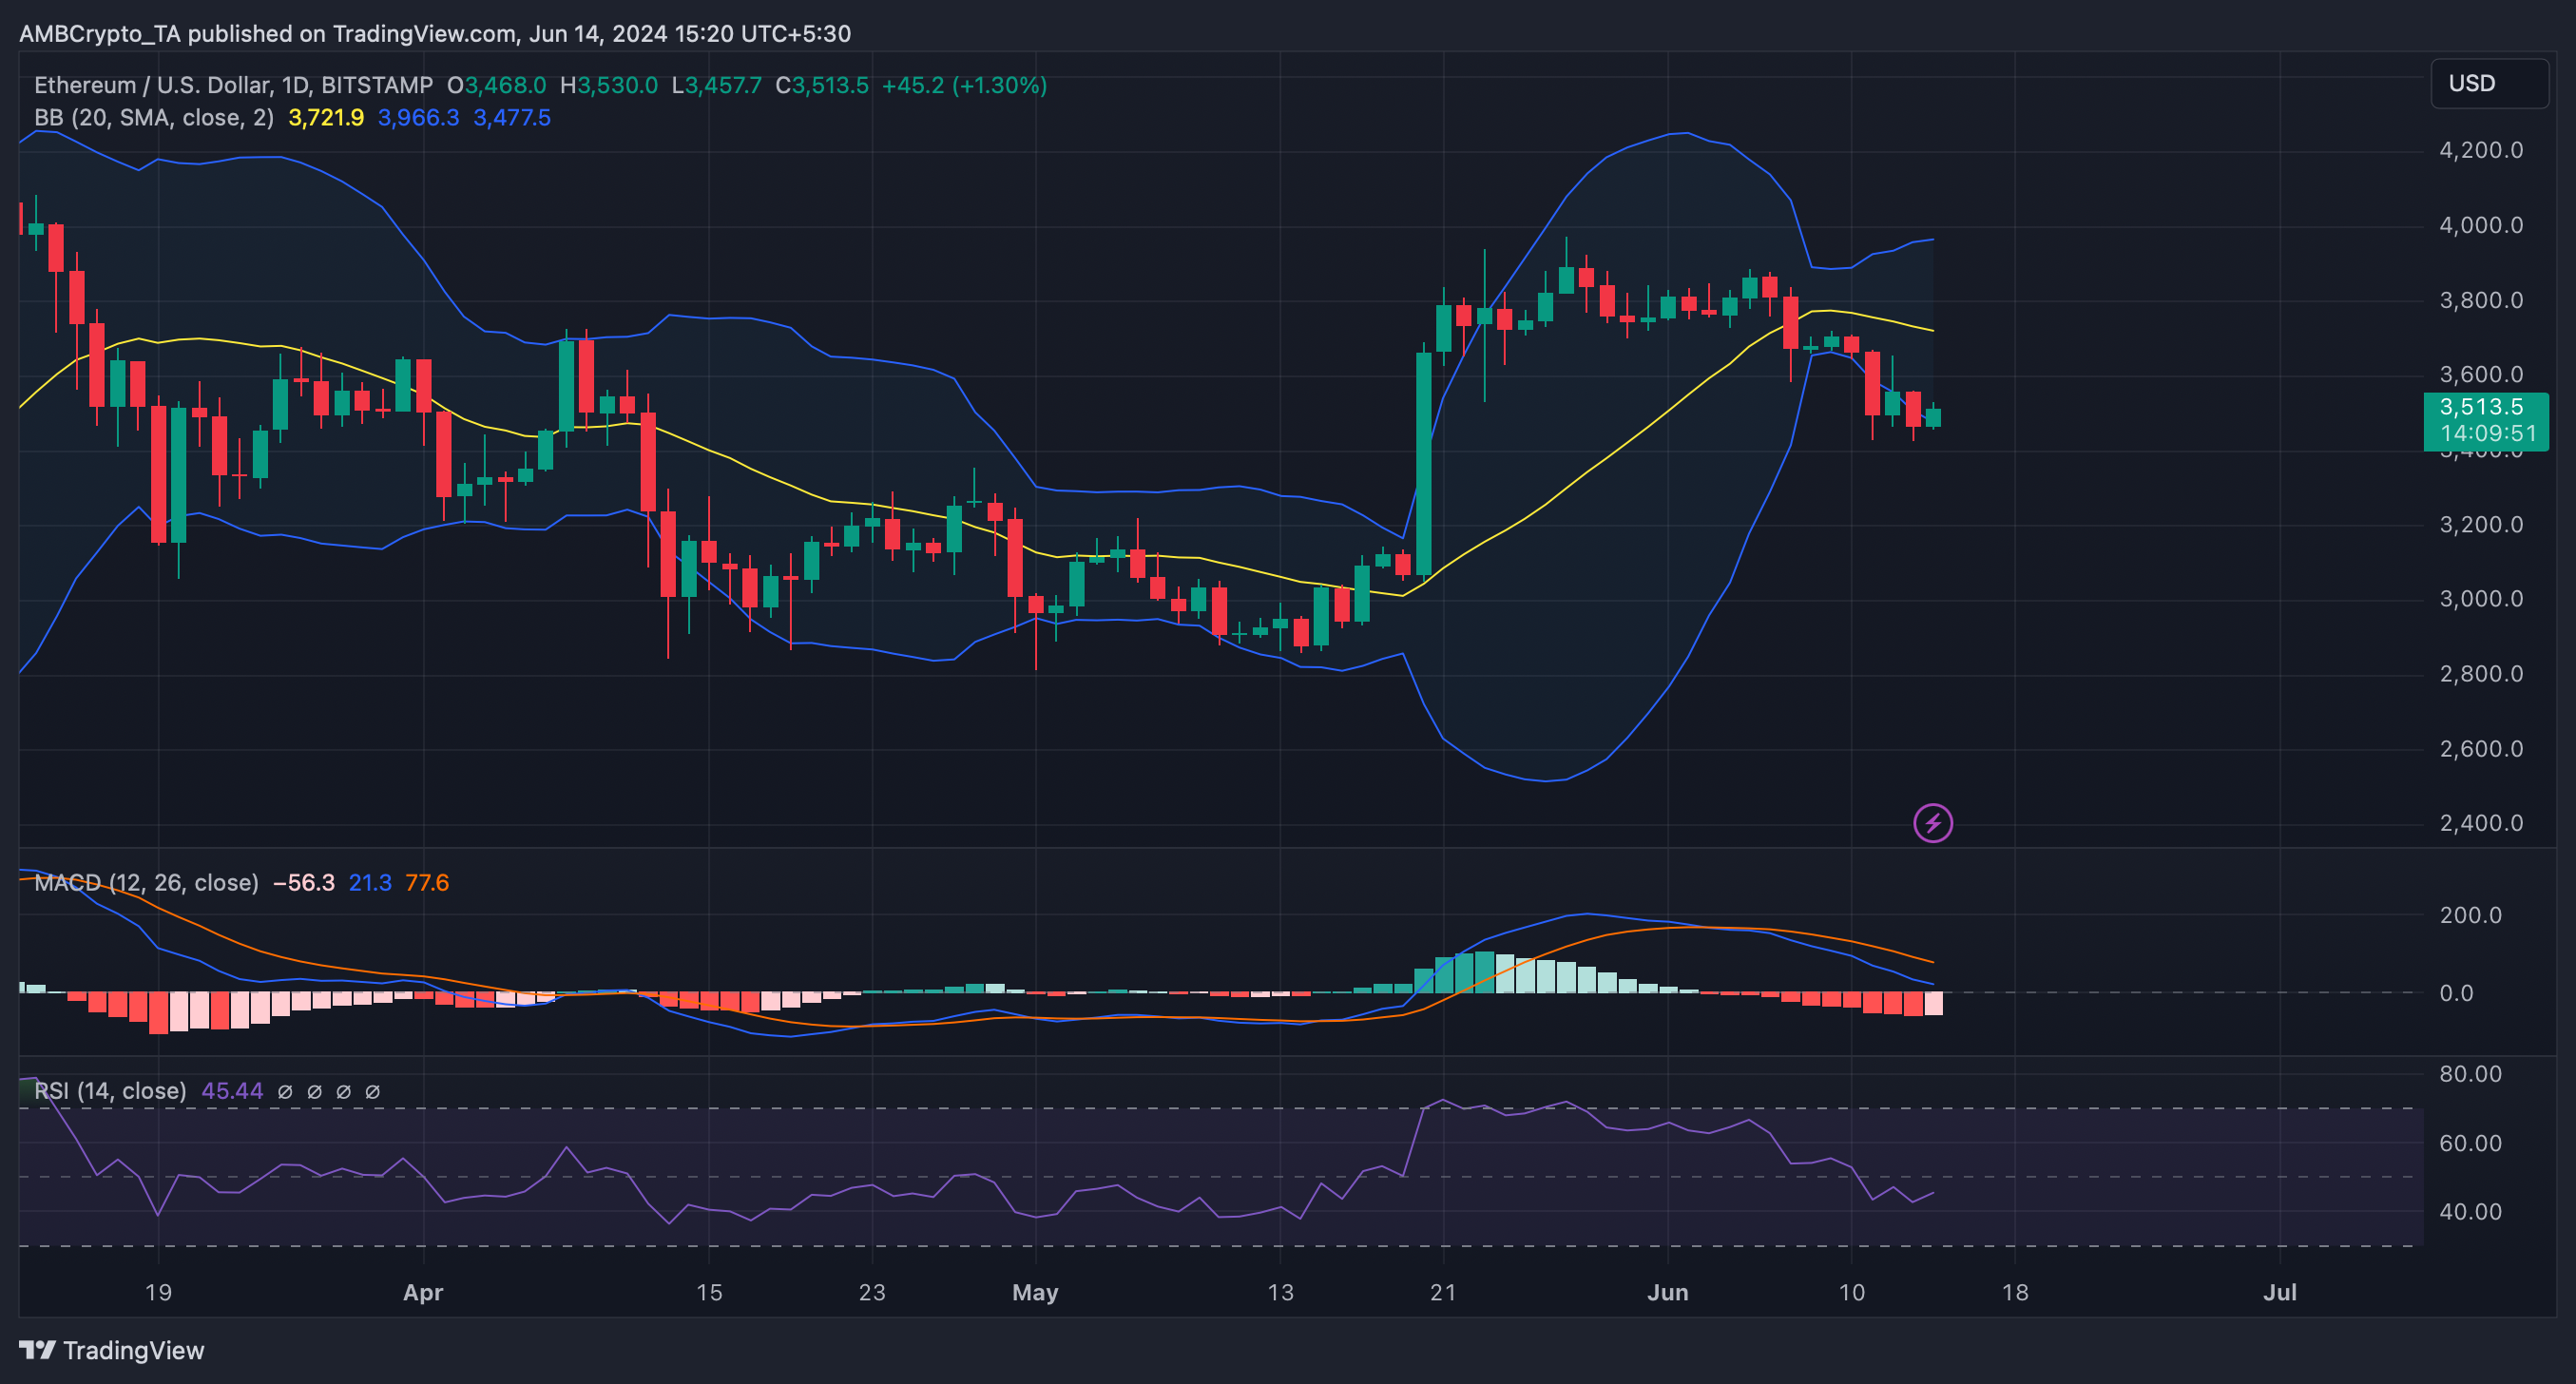
Source: TradingView
Read Ethereum (ETH) Price Prediction 2024-25
AskFX then checked ETH’s liquidation heatmap to look for possible support and resistance levels. We have noted that if ETH turns bullish in the coming days, investors could see a price of $3,675 in the coming days.
However, if ETH fails to test the bullish flag pattern, the token could drop to $3,500 in the short term.

Source: Hyblock Capital