What’s Next for ETH?

Journalist
- While ETH price fell, whales deposited millions of dollars worth of tokens
- Few metrics and indicators suggested that ETH was undervalued
As the crypto market experienced a crash last week, the king of altcoins, Ethereum [ETH] also fell victim to a massive price correction. Due to the price drop, many may have lost faith in the token. However, the trend changed in the last few hours as ETH’s daily chart soon turned green.
Ethereum’s High Volatility
CoinMarketCap data showed that ETH price had fallen by more than 12% in just seven days. AskFX’s analysis of IntoTheBlock data also revealed that the average ETH balance decreased, attributed to the token’s double-digit price drop.
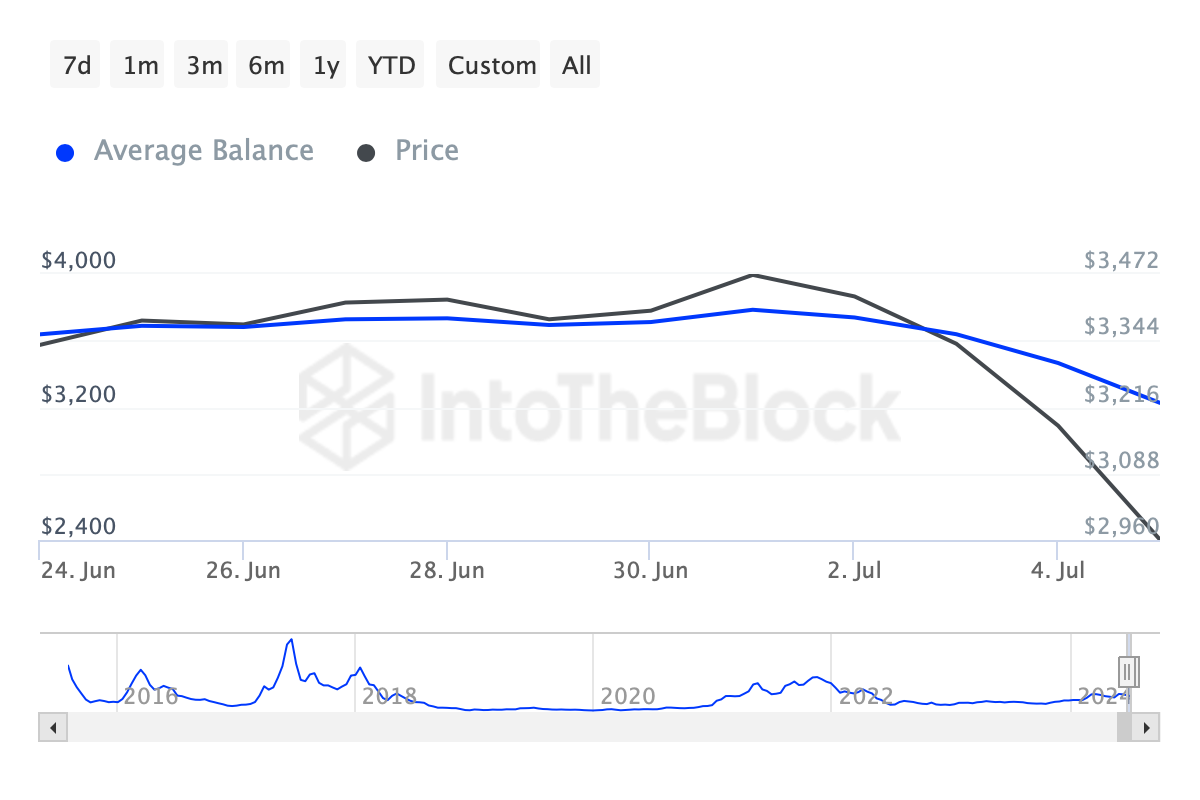
Source: IntoTheBlock
Meanwhile, Lookonchain posted a tweet sharing an interesting development. According to them, several whales started selling ETH when its value dropped. More specifically, three Ethereum whales deposited 28,558 ETH worth over $82.2 million on Binance. However, shortly after, ETH price saw a reversal on the charts.
In fact, the altcoin’s price has increased by almost 3% in the last 24 hours alone. At the time of writing, ETH was trading at $2,967.81, with a market cap of over $356 billion.
However, despite the price increase, trading volumes dropped by double digits. This indicated that ETH might not be able to sustain its bullish momentum for long.
Will ETH’s bullish rally continue?
Like trading volume, some other metrics also looked quite bearish.
For example, although ETH saw a price increase, selling pressure on the token continued to remain high. This was evidenced by looking at data from CryptoQuant, which highlighted an increase in ETH’s exchange reserves. Simply put, several investors decided to sell.
Source: CryptoQuant.
Other metrics also pointed to a possible uptrend.
For example, ETH’s funding rate has increased. This means that traders with long positions dominate and are willing to pay for traders with short positions. According to CryptoQuantits Relative Strength Index was also in the oversold territory. This could increase buying pressure in the next few days and lead to a possible price increase on the charts.
AskFX’s analysis of Glassnode’s data showed that EThereum’s NVT ratio had also dropped dramatically. This metric indicates that an asset was undervalued. Price increases are usually the result of a drop in this metric.
Glassnode.
Then we wanted to look at ETH’s daily chart to understand what to expect. We discovered that ETH touched the lower Bollinger Bands – highlighting the likelihood of a recovery.
Read Ethereum [ETH] forecast
2024-25. However, the Chaikin Money Flow (CMF) was bearish, at -0.09 at press time.
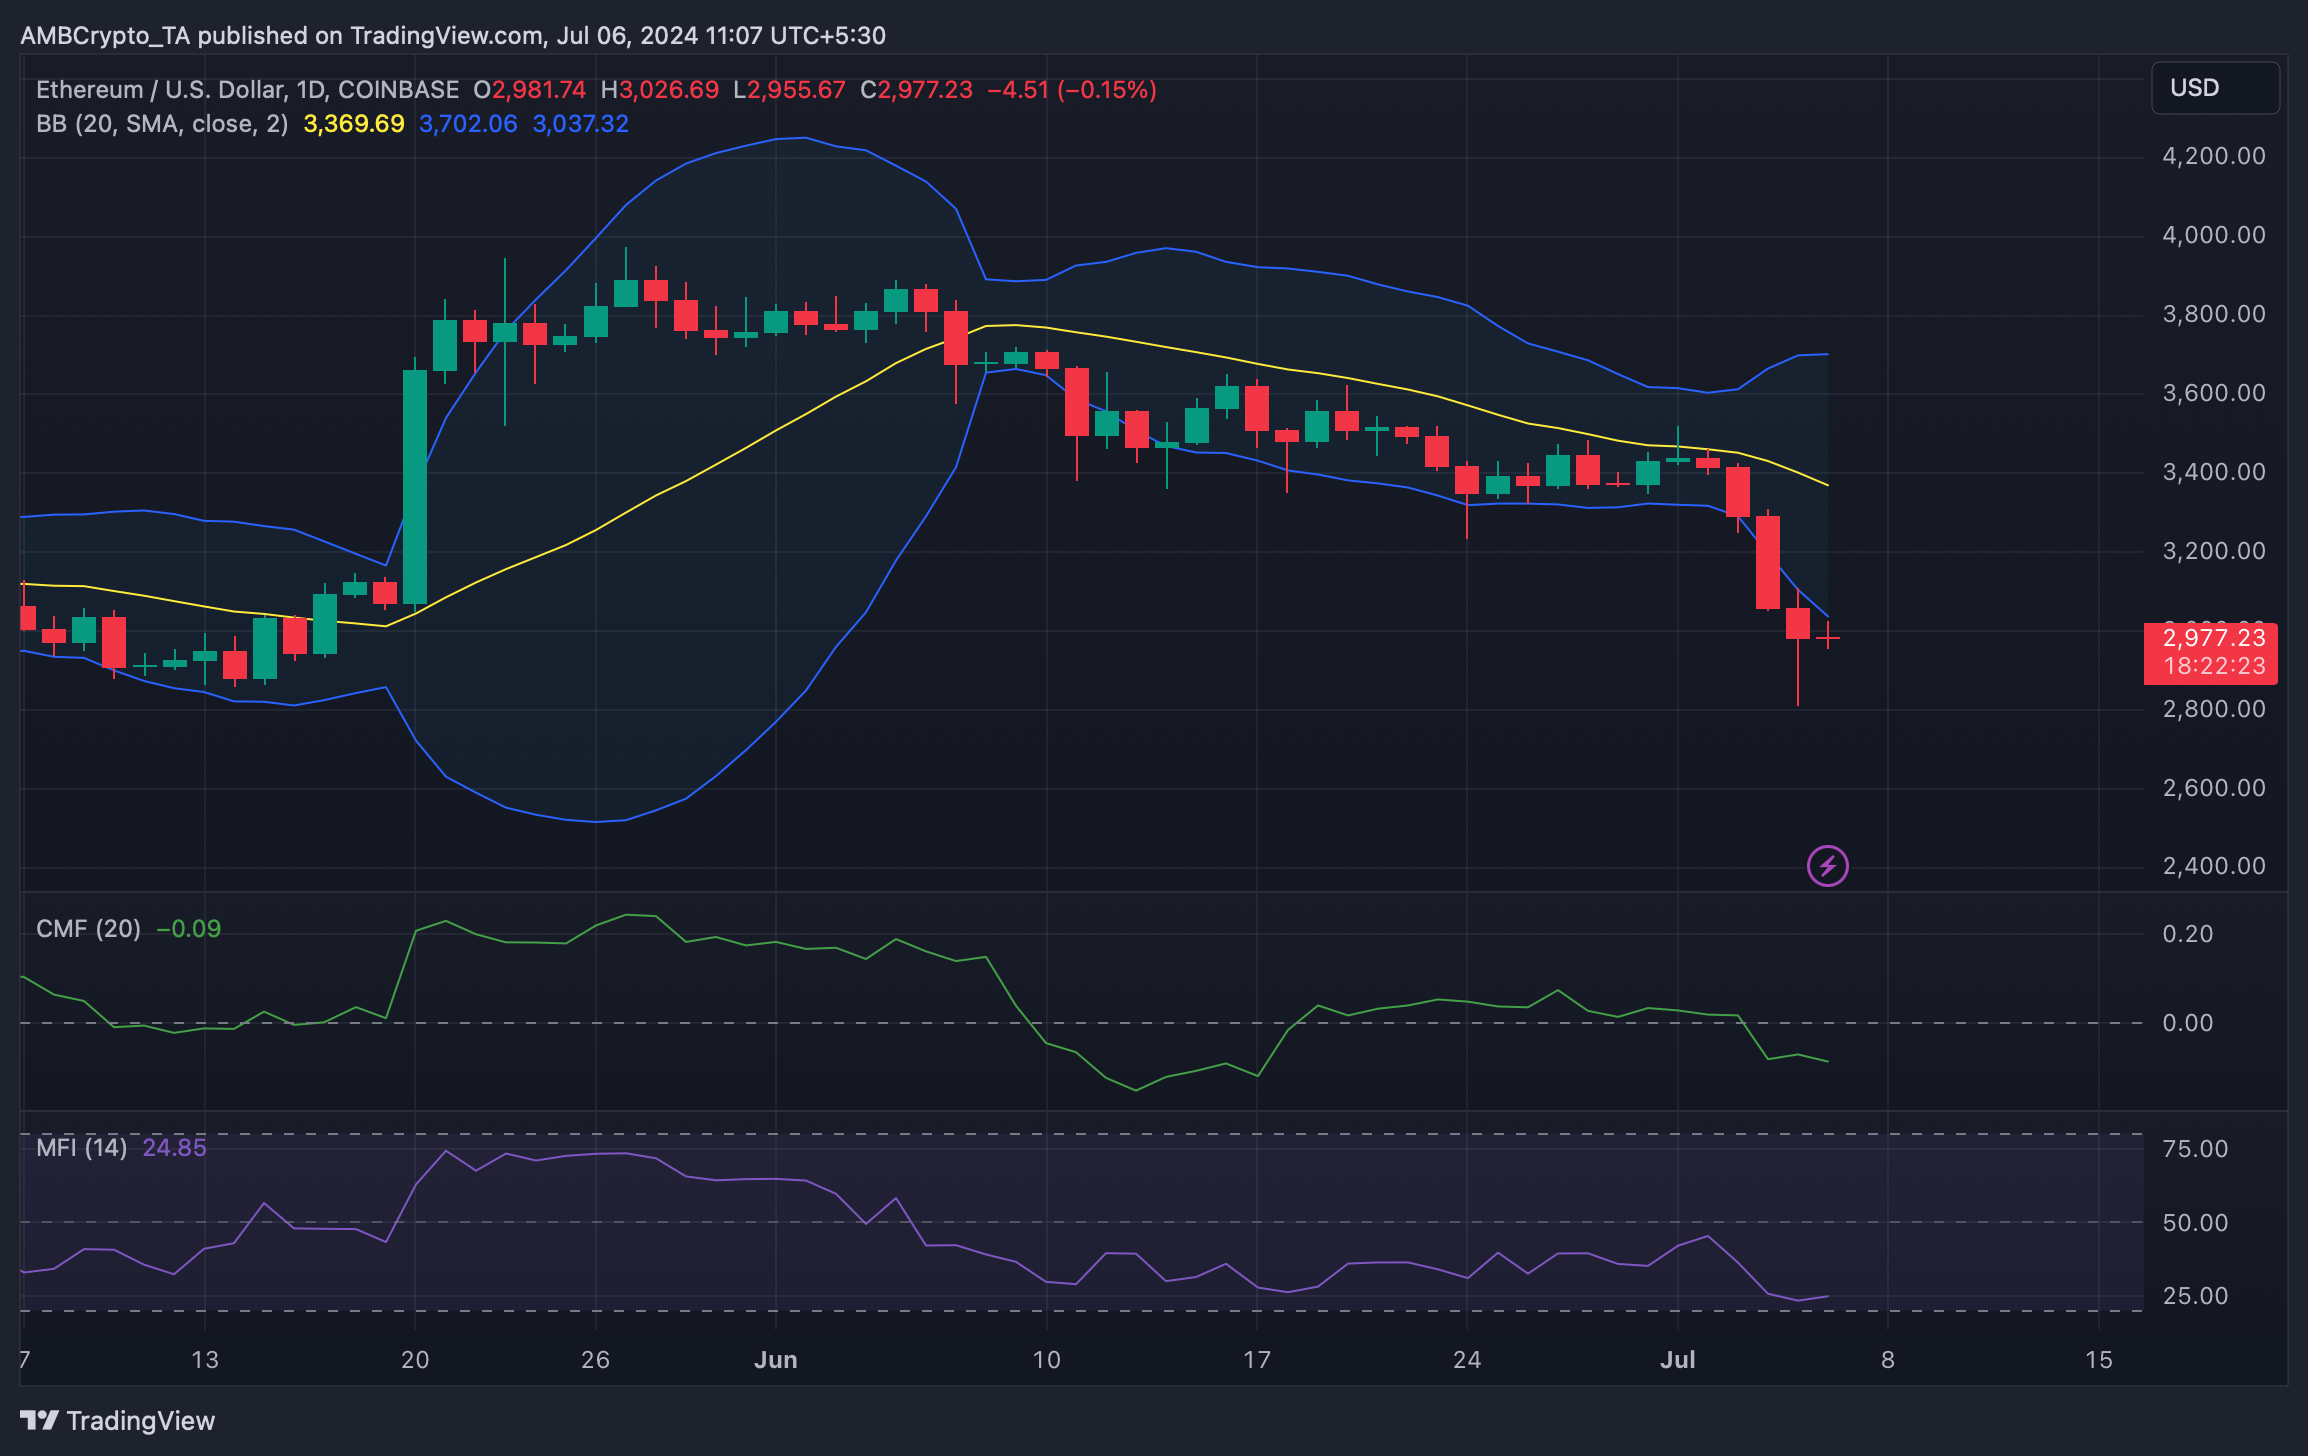
TradingView