Bitcoin Breaks $60,000 – Will $88,000 Be the Next BTC Milestone?

Financial Analyst
- The BTC price has increased by more than 3% in the last 24 hours.
- Most metrics and indicators were bullish for the coin.
Bitcoin [BTC] has shown signs of recovery after several weeks, breaking the $60,000 mark. Although this development looked optimistic, the latest analysis suggested that BTC could reach new highs in 2024. Let’s take a look at the BTC metrics to see if this is likely.
Bitcoin’s path to new highs
Data from CoinMarketCap showed that the price of the king of cryptocurrencies has increased by more than 3% in the last 24 hours, and it has once again exceeded the $60,000 mark. At the time of writing, BTC was trading at $60,172, with a market capitalization of over $1.17 trillion.
Thanks to this, more than 83% of BTC investors made a profit.
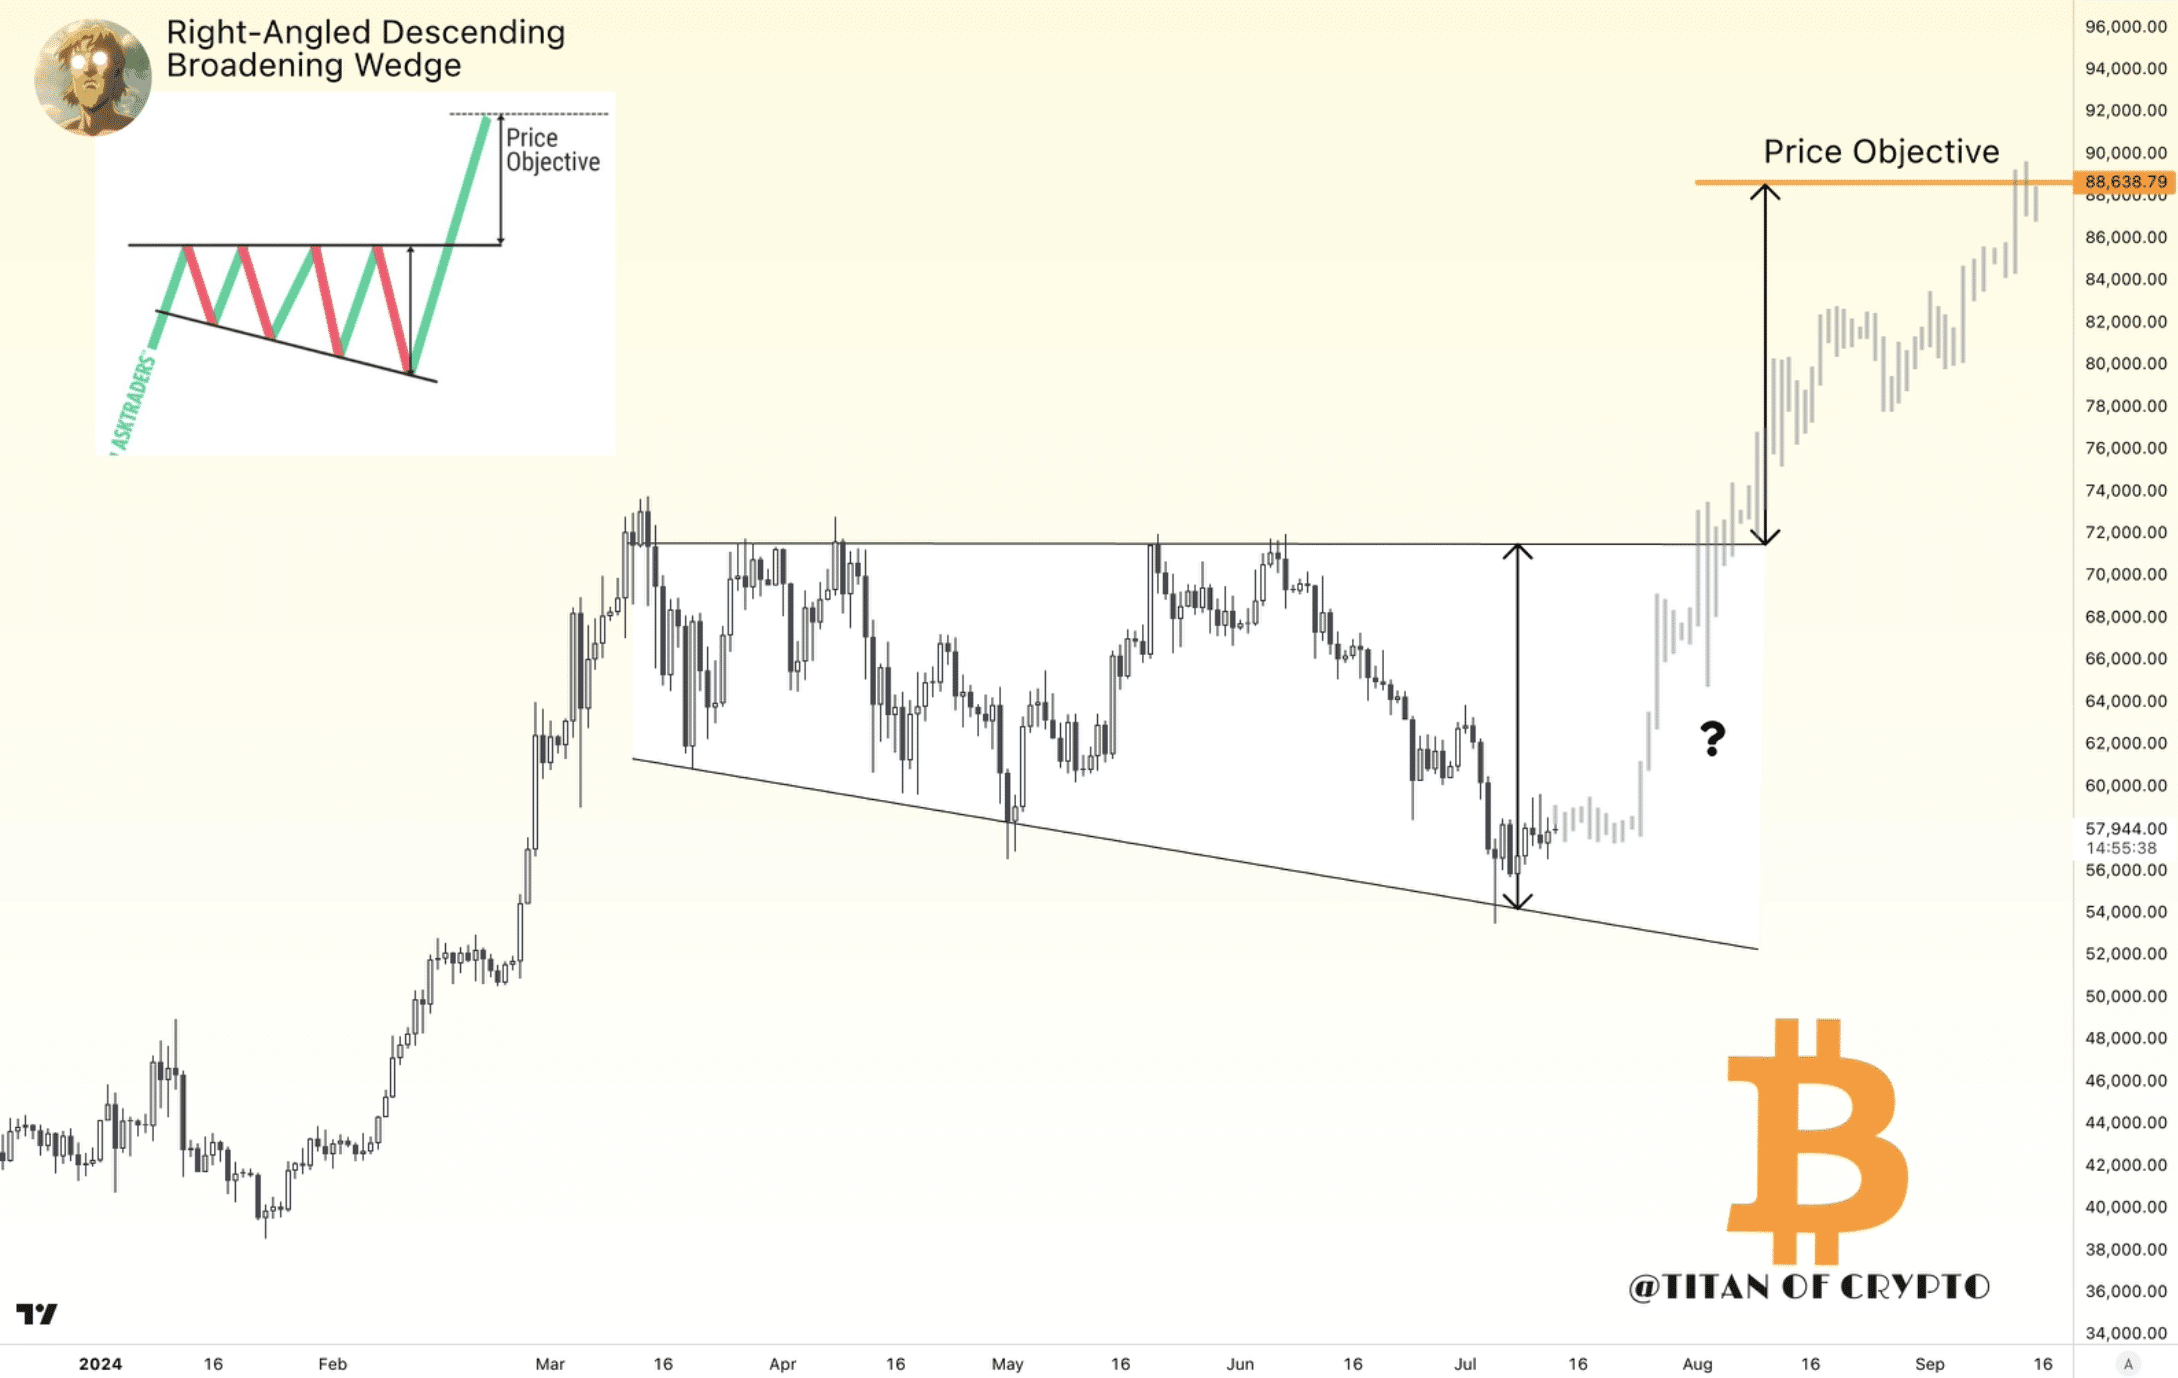
Things might get even better in the coming days as Titan of Cryptos, a well-known crypto analyst, posted a tweet pointing out an interesting development. According to the tweet, a right-angle descending broadening wedge pattern appeared on the BTC chart.
If BTC tests the pattern, the recent price increase could be just the beginning of a massive rally. In fact, the upcoming rally could push BTC to $88,000 in September. If that actually happens, 100% of BTC investors will make profit.
Source: X
Is Bitcoin Ready for a Pump?
Since the analysis highlighted the possibility of a massive bull rally, AskFX planned to take a look at its metrics to find out what they suggest.
Our analysis of CryptoQuant’s data revealed that net deposits of BTC on exchanges were lower compared to the average of the past seven days. This means that buying pressure on the coin was high.
Its binary CDD was green, indicating that long-term holders’ movements were below average over the past seven days. They have a motive to hold on to their coins.
Furthermore, miners also showed confidence in BTC. This was evident from the fact that its Miners’ Position Index (MPI) was green, indicating that miners were selling less holdings compared to its one-year average.
Source: CryptoQuant
We then looked at the coin’s daily chart to see what the market indicators were suggesting. We found that most indicators were in favor of the bulls, pointing to further price increases.
Read Bitcoins [BTC] Price Prediction 2024-2025
For example, the MACD showed a bullish crossover. Its Relative Strength Index (RSI) recorded an uptrend.
A similar uptrend was also noted on the coin’s Chaikin Money Flow (CMF) chart, suggesting that BTC could continue to increase its value and reach a new high by September.
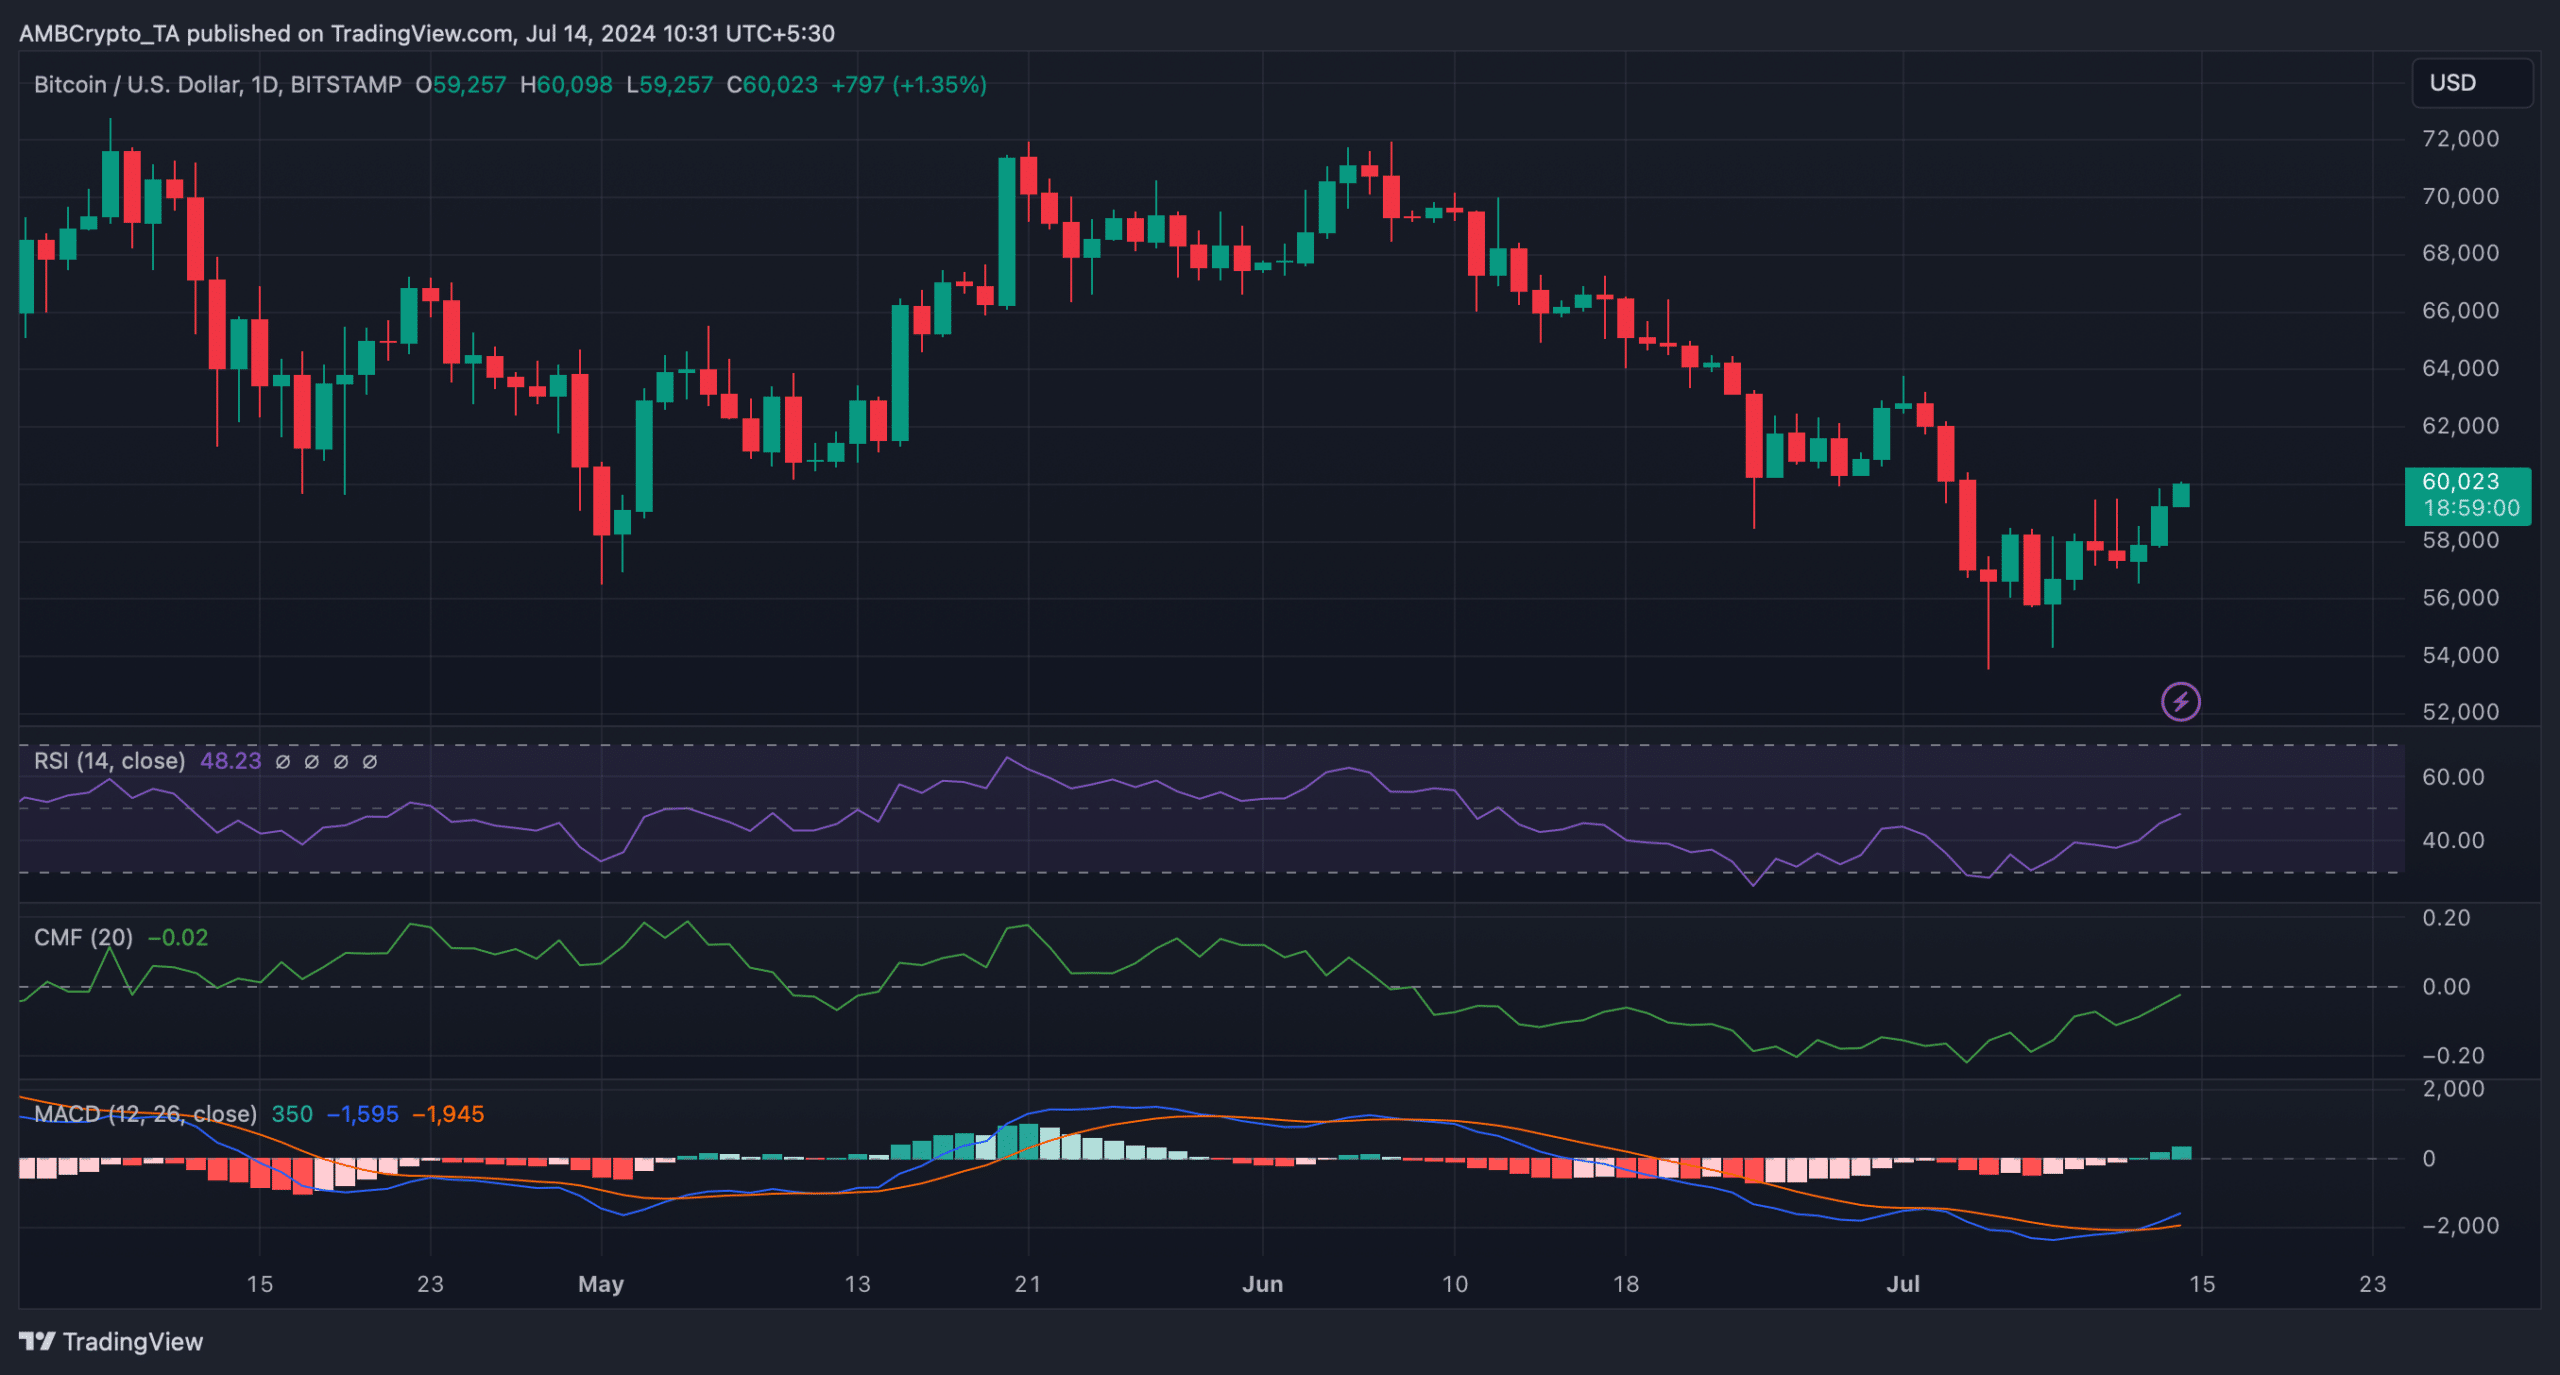
Source: TradingView