Cardano Price Might Surprise You After Bitcoin Halving. Here’s How

Journalist
- ADA has fallen by more than 23% in the last seven days.
- Most metrics and indicators support the possibility of ADA testing the bull pattern.
Similar to most cryptocurrencies, Cardano [ADA] bears led the market as the token’s price charts remained red. However, there were changes towards a trend reversal as a bull pattern formed on the ADA chart.
Will this allow ADA to turn its charts green as Bitcoin [BTC] undergoes its next halving on April 19?
Cardano bulls awaken
The last week has been disastrous for ADA investors as the token’s price fell by a whopping 23%. According to CoinMarketCapADA has fallen by over 2.5% in the last 24 hours.
But that was not all, as at press time, ADA’s price was consolidating inside a bullish symmetrical triangle pattern, indicating a bullish rally.
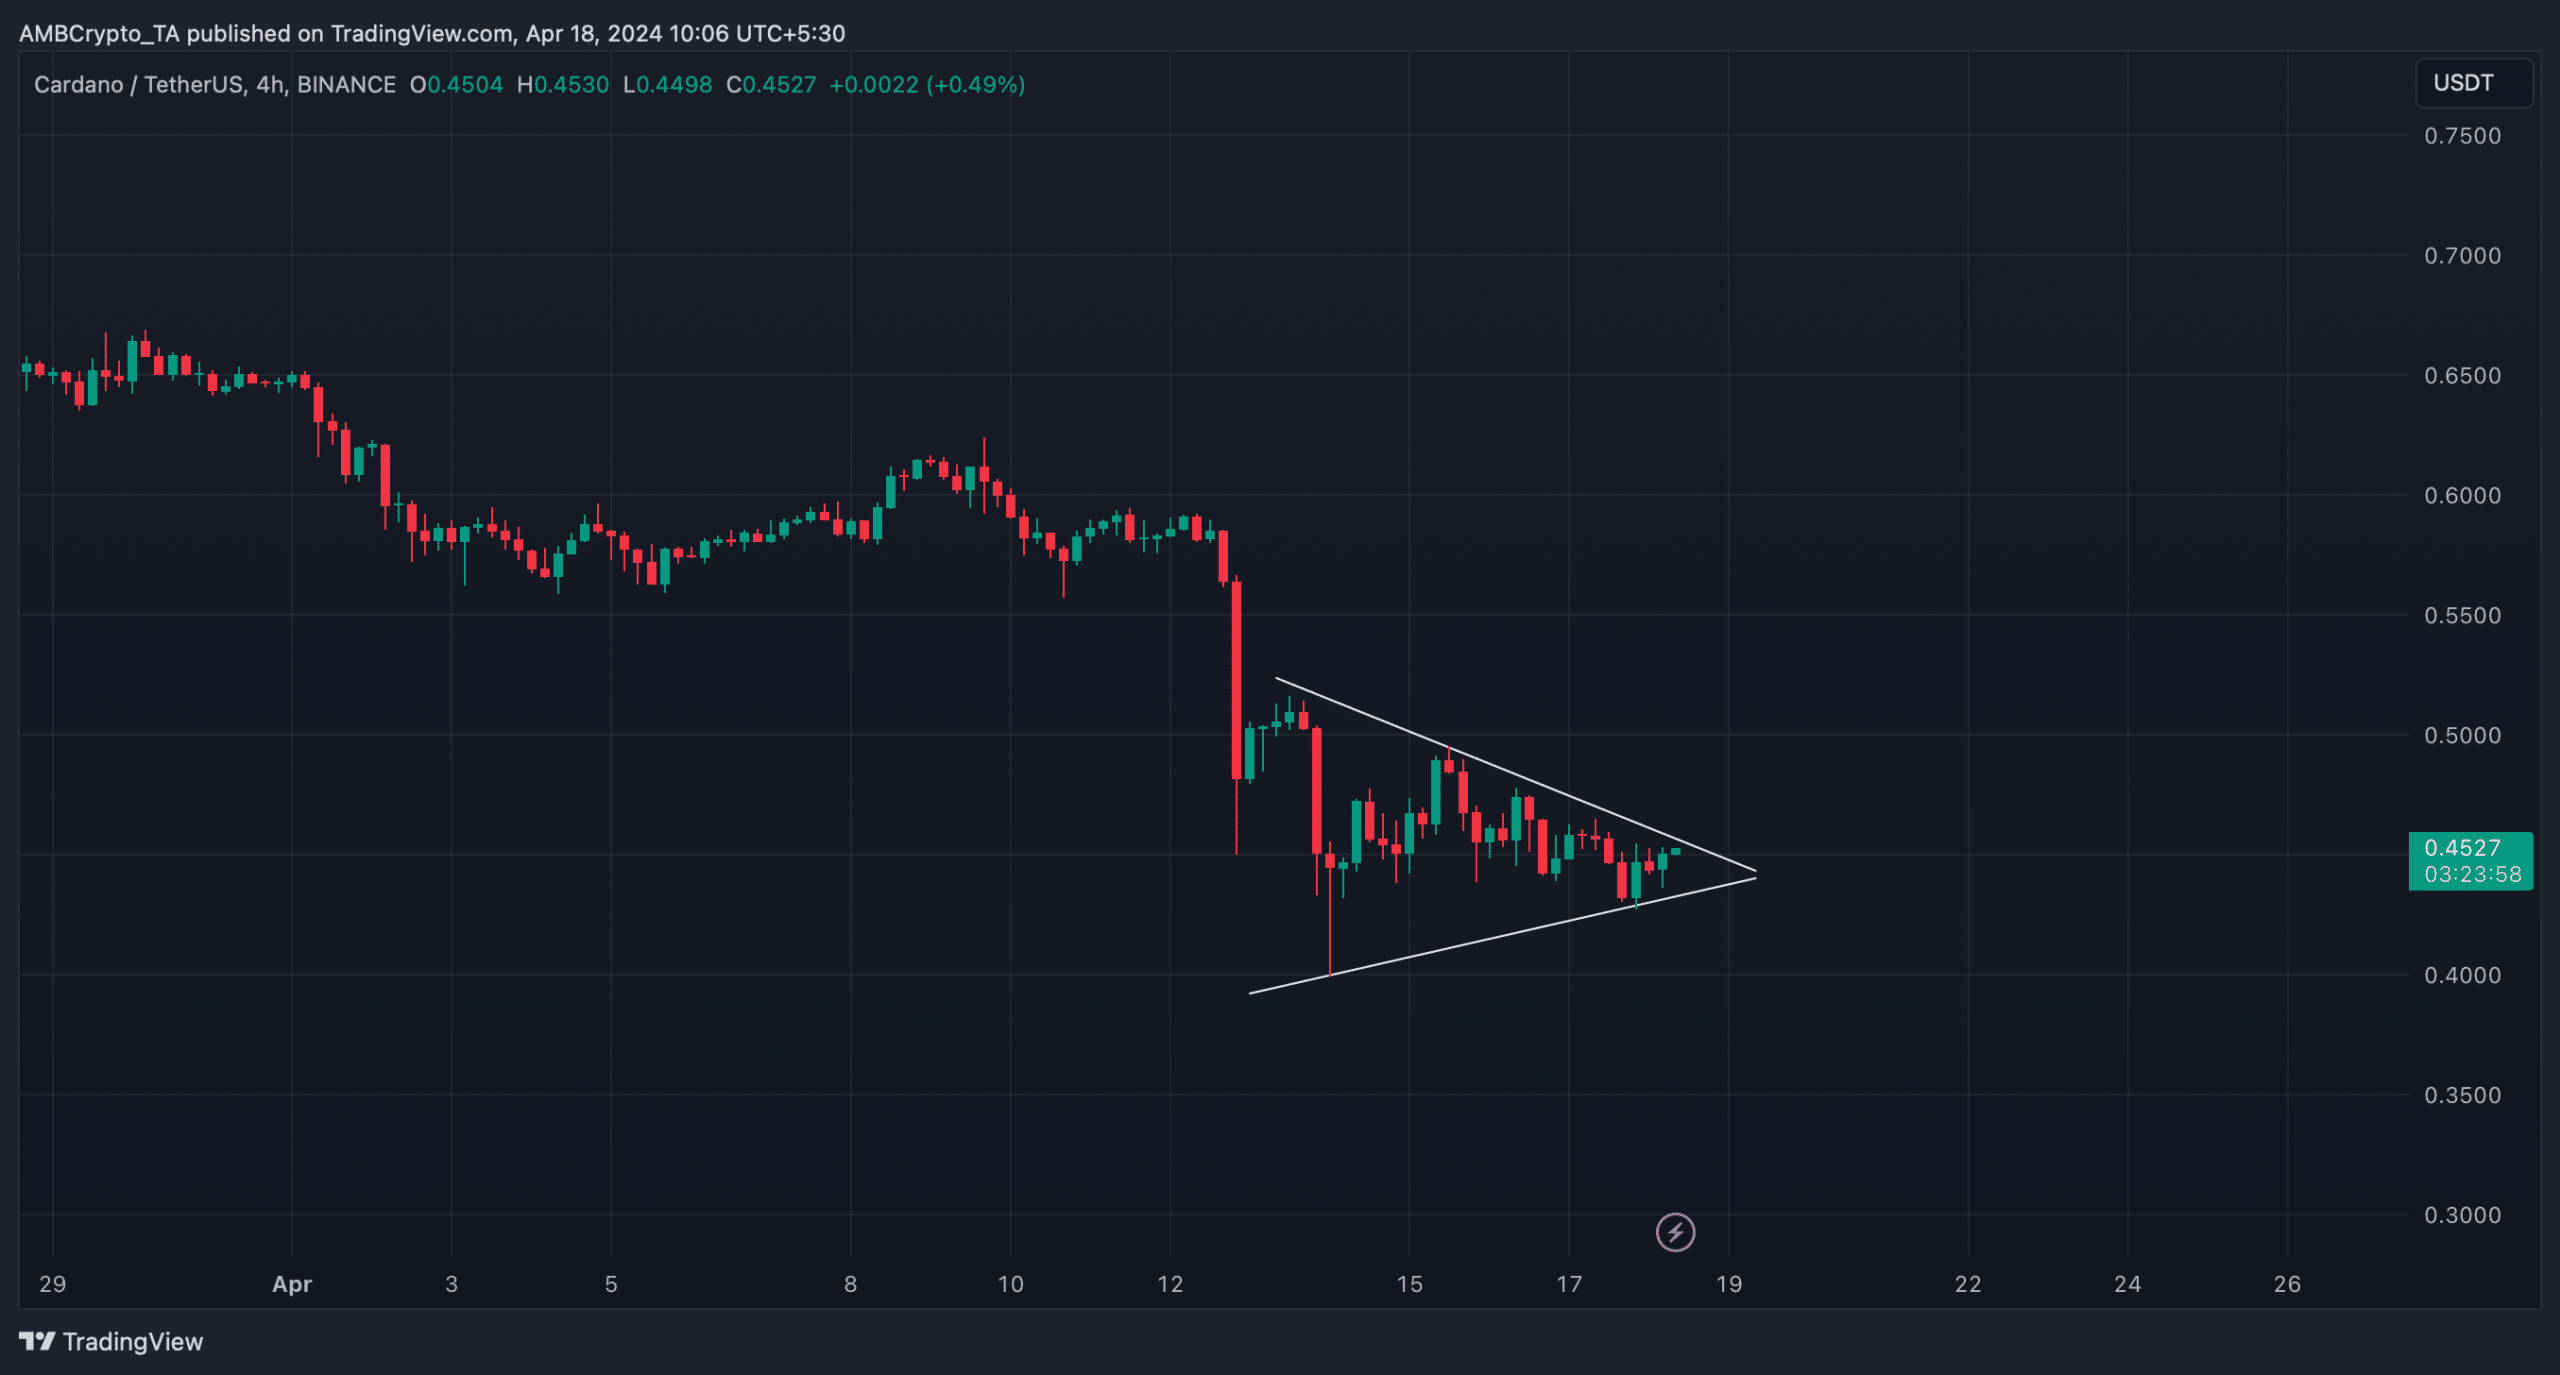
Source: TradingView
AskFX’s analysis of ADA’s 4-hour chart revealed that if the token’s price breaks the $0.454 resistance level, it could witness a strong bull rally as BTC undergoes its fourth halving process.
The possibility of ADA testing the pattern seemed high as the token’s price had increased by 1.15% in the last 60 minutes.
At press time, it was trading at $0.4498, with a market cap of over $16 billion, making it the 10th largest cryptocurrency.
ADA on the right track
Apart from the price action, some metrics also looked bullish. AskFX’s review of Santiment data revealed that ADA’s 7-day MVRV ratio has improved over the past few days.
The funding rate had also dropped. Since prices tend to move in the opposite direction to the funding rate, there was a possibility that ADA may see a price increase soon.
Santiment
Throughout the week, the token’s social activity volume remained high. However, the volume spiked on April 14. Cardano is clearly popular in the crypto space, as evidenced by its increase in social volume.
Its weighted sentiment rose last week after falling on April 14, suggesting that the bearish sentiment surrounding the token was waning.
Santiment
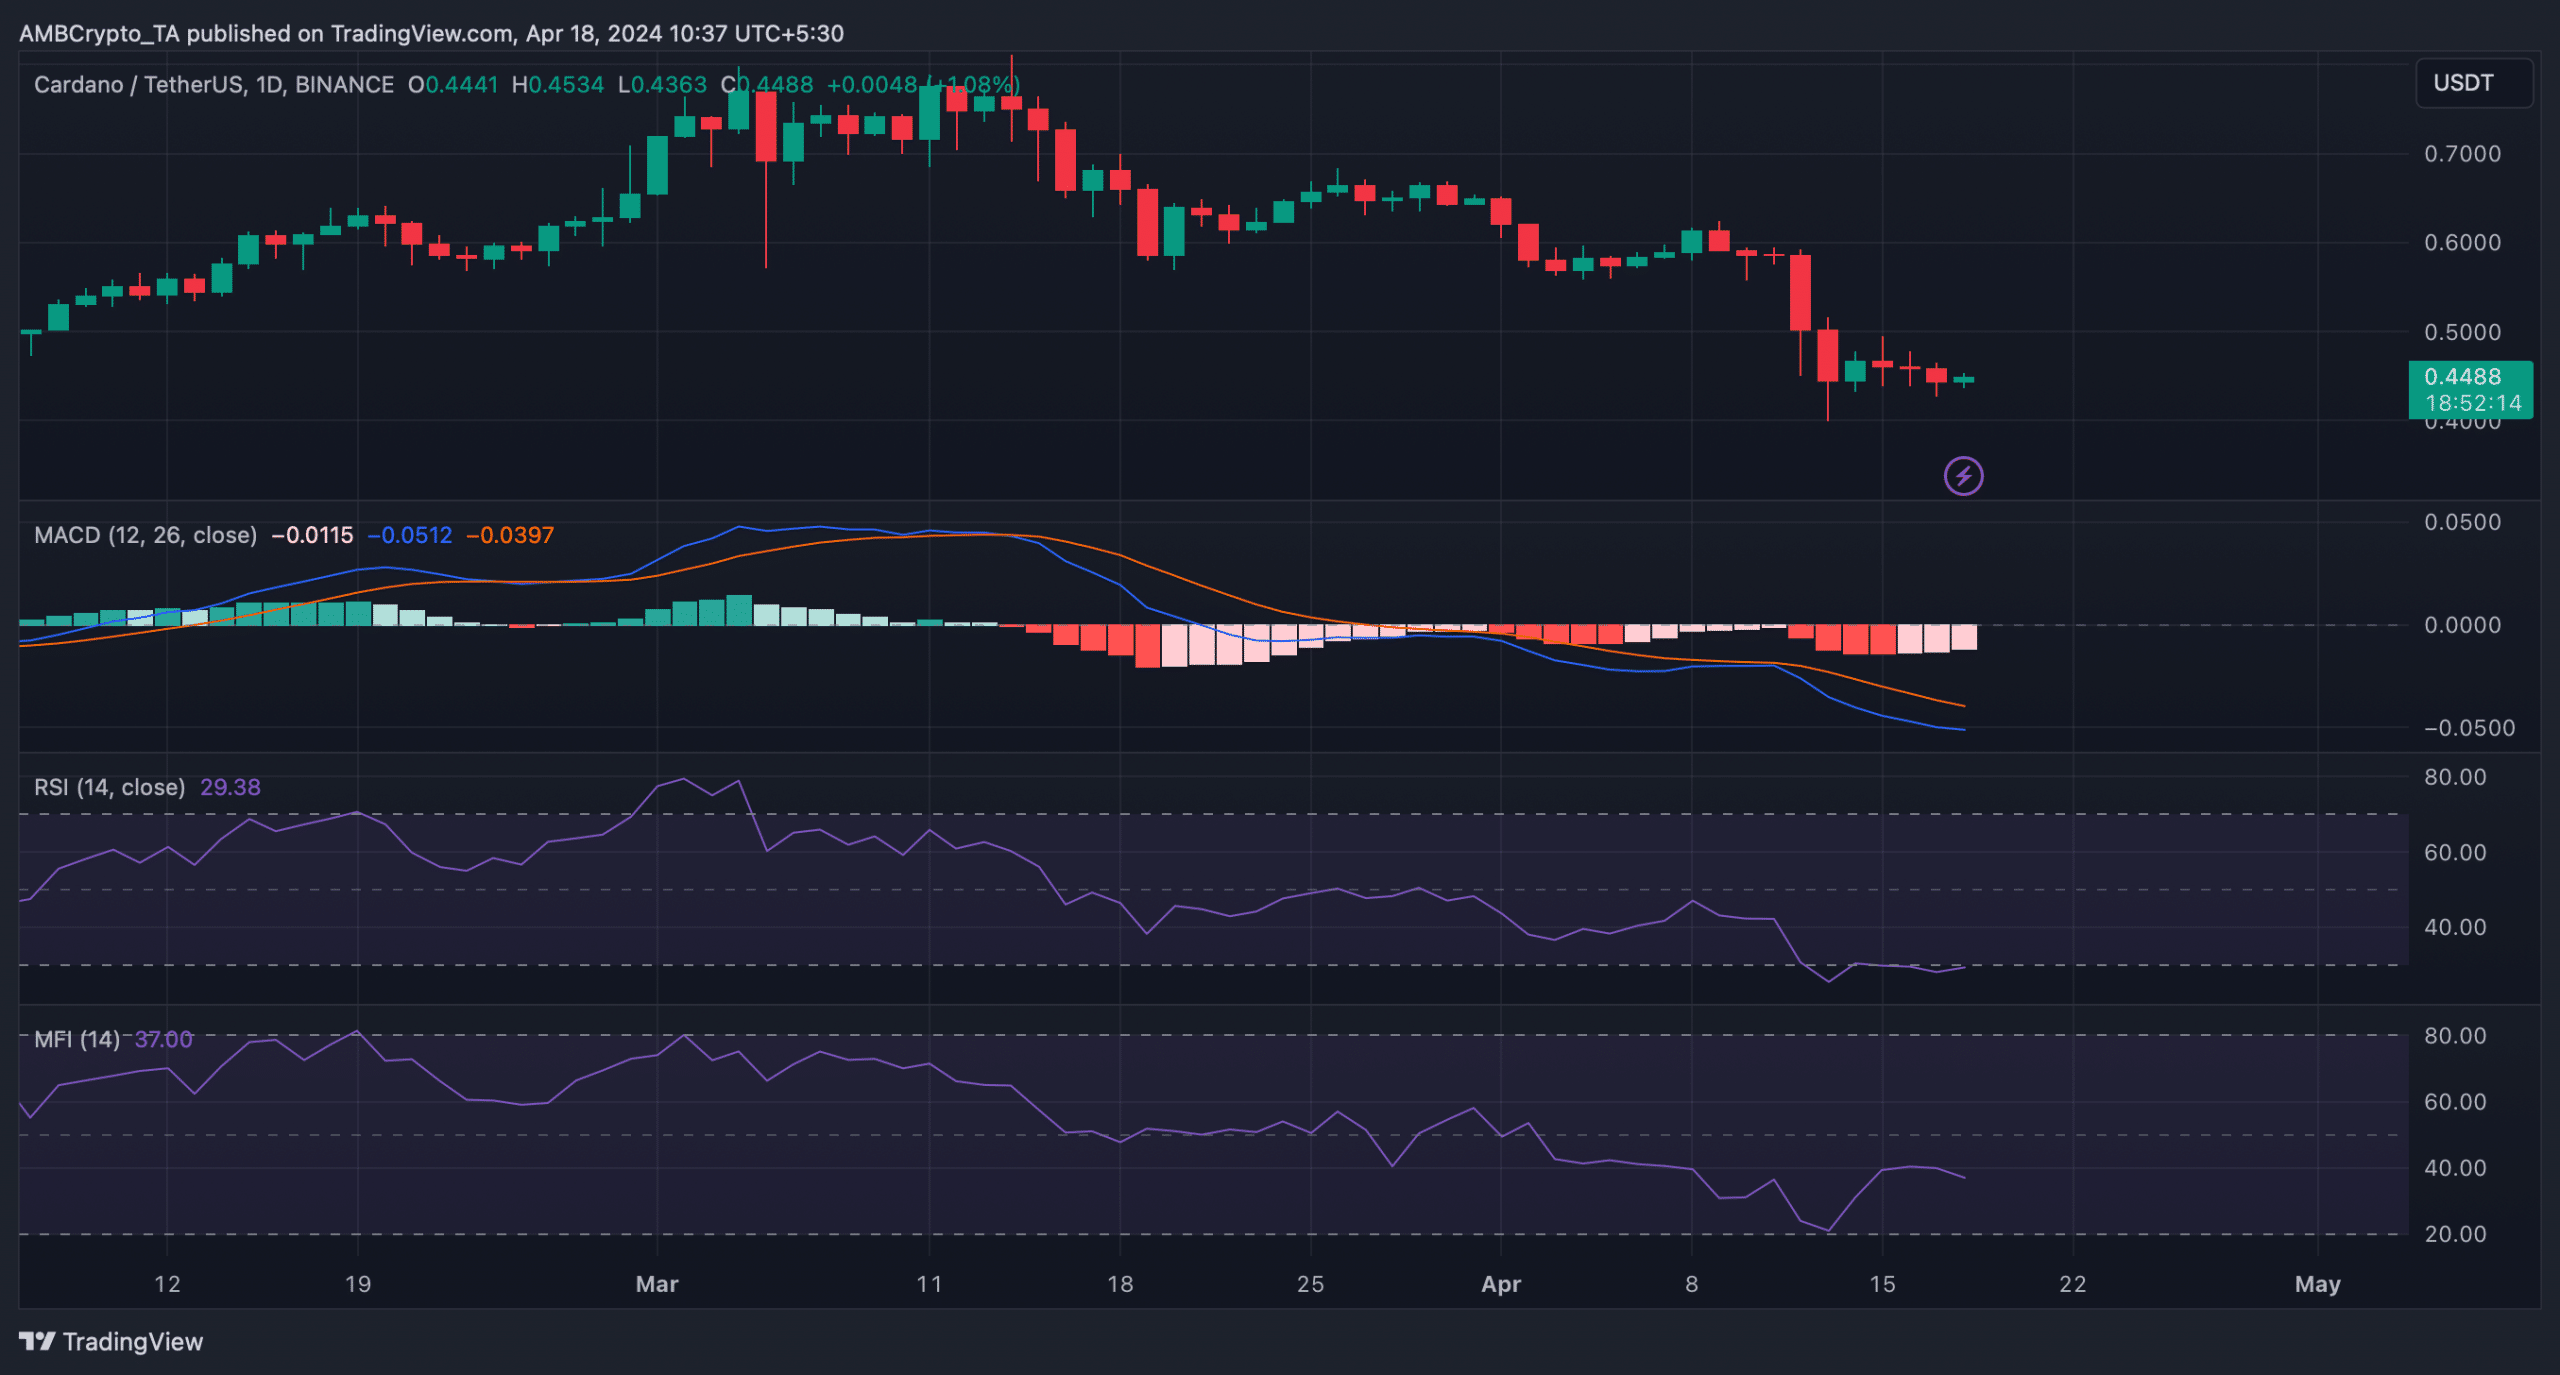
We then looked at the daily chart to better understand if ADA could break the $0.454 resistance level. Cardano’s Relative Strength Index was in an oversold region.
Read Cardano’s [ADA] price prediction.
2024-25. This showed that buying pressure for the token could increase in the near future, leading to a price increase. The MACD showed a market advantage for the bears.
The Money Flow Index (MFI), which was also bearish, suggested the possibility that ADA may take longer to turn bullish.
TradingView[196537]