Is Solana About to Crash? The Support at $159 Could Be Weakened

Contributor
- Solana price is likely to reach $153 if the key support level at around $159 is breached.
- Bearish momentum for Solana has been confirmed by on-chain metrics and the technical indicators.
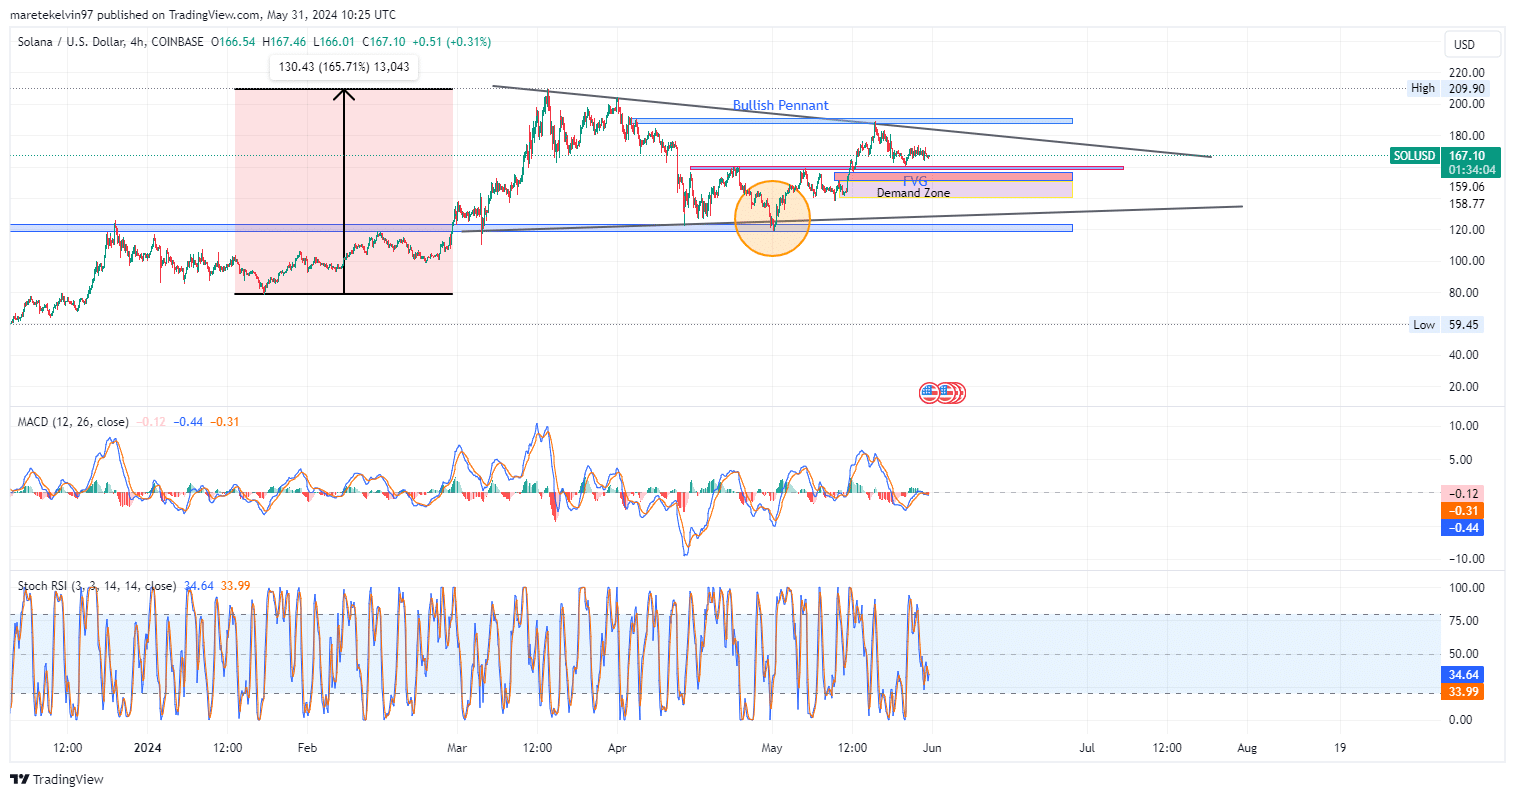
Solana [SOL] price was consolidating at press time, forming a pennant pattern after a significant upward push over the past three months. Solana showed bearish momentum despite the bullish pattern.
Price is rallying in a bearish move towards the resistance level turned into support at $159. If this support level is breached, the price could continue to fall and close the fair value gap at around $153.
At the time of writing, Solana price was trading at $168, up 0.68% in the last 24 hours and 1.3% in the last seven days, according to coinmarketcap.
The market capitalization is around $77 billion, while the trading volume is $77.2 billion, up 12.4% in the last 24 hours.
Despite the slight price increase, the bullish momentum is fading.

Source: Trading View
Is the current sentiment bearish?
AskFX analyzed Santiment’s Social Volume indicator and found increased volume and a predominantly decreasing volume trend in the short term. The metrics are consistent with the bearish momentum of SOL price.

Source: Santiment
AskFX also analyzed Coinglass’s Long/Short ratio, which showed more short than long positions for Solana. The ratio indicates that investors expect a further price collapse, confirming the bearish pattern.

Source: Coinglass
Tradingview chart indicator MACD indicated bearish momentum on SOL that could break the support level of $159 and drop to $153.
The MACD line below the signal line indicated a bearish crossover, with the large negative bars of the histogram confirming the downward momentum of the price.
Stochastic RSI (34.4) is not within the limits but is trending towards the lower boundary, indicating a neutral to slightly oversold market.
Source: Tradingview
Is your portfolio in the green? Check out SOL Profit Calculator
Technical indicators and on-chain analysis agree and suggest a possible bearish momentum of the fair value gap at $153.
MACD showed decreasing momentum, which was confirmed by the Stochastic RSI. However, if the price fails to break the support level, a possible uptrend is likely.