Maneki Crypto Overtakes BOME with 200% Increase

Journalist
- The price of MEW has increased by more than 200% since its launch.
- The sentiment around BOME was bearish while MEW’s metrics looked bullish.
The memecoin hype shows no signs of slowing down and a wave of new cryptocurrencies is flooding the market. Among them is the quirky newcomer: Cat in a dogs world [MEW].
Solana-based memecoin MEW came into the spotlight when it managed to outshine Book of MEME [BOME]. However, at press time, BOME had quickly regained its position.
MEW’s robust growth
It has only been a month since MEW was launched and in that short time, it has seen explosive growth. According to CoinMarketCapthe newly launched memecoin has increased in value by more than 200% in the last 30 days.
The massive price increase has quickly made MEW a mainstream memecoin.
In fact, according to a recent tweet by SolanaFloor, MEW managed to overtake BOME in terms of market cap.
However, the trend did not last long as BOME quickly increased its market cap and overtook MEW. The reason for this was the high volatility of the market.
On the one hand, BOME’s price increased by almost 4% in the last 24 hours, on the other hand, MEW’s price increased by only 1% in the same period.
At press time, BOME was trading at $0.01077, making it the 122nd largest cryptocurrency. MEW was valued at $0.005876.
Although BOME took the lead, the difference between the market caps of these two memecoins was only $70 million. Therefore, AskFX took a closer look at its metrics to see if MEW can outshine BOME in the coming days.
BOME vs. MEW
AskFXs analysis of Santiment’s data revealed that MEW and BOME’s social volumes remained comparable over the past week.
However, the market sentiment around them was different. MEW’s weighted sentiment recorded a spike on April 25, indicating that the bullish sentiment around it was increasing.
The case with BOME was different as its weighted sentiment remained in the negative zone, meaning that the bearish sentiment around it was dominating the market.
Santiment
Then, we analyzed the daily charts of both meme coins to determine their direction. We discovered that BOME’s MACD showed a bullish edge in the market. This indicated a price increase.
However, its relative strength (RSI) was below the neutral mark. This indicated that the bull run could end soon, which could allow MEW to overtake BOME.
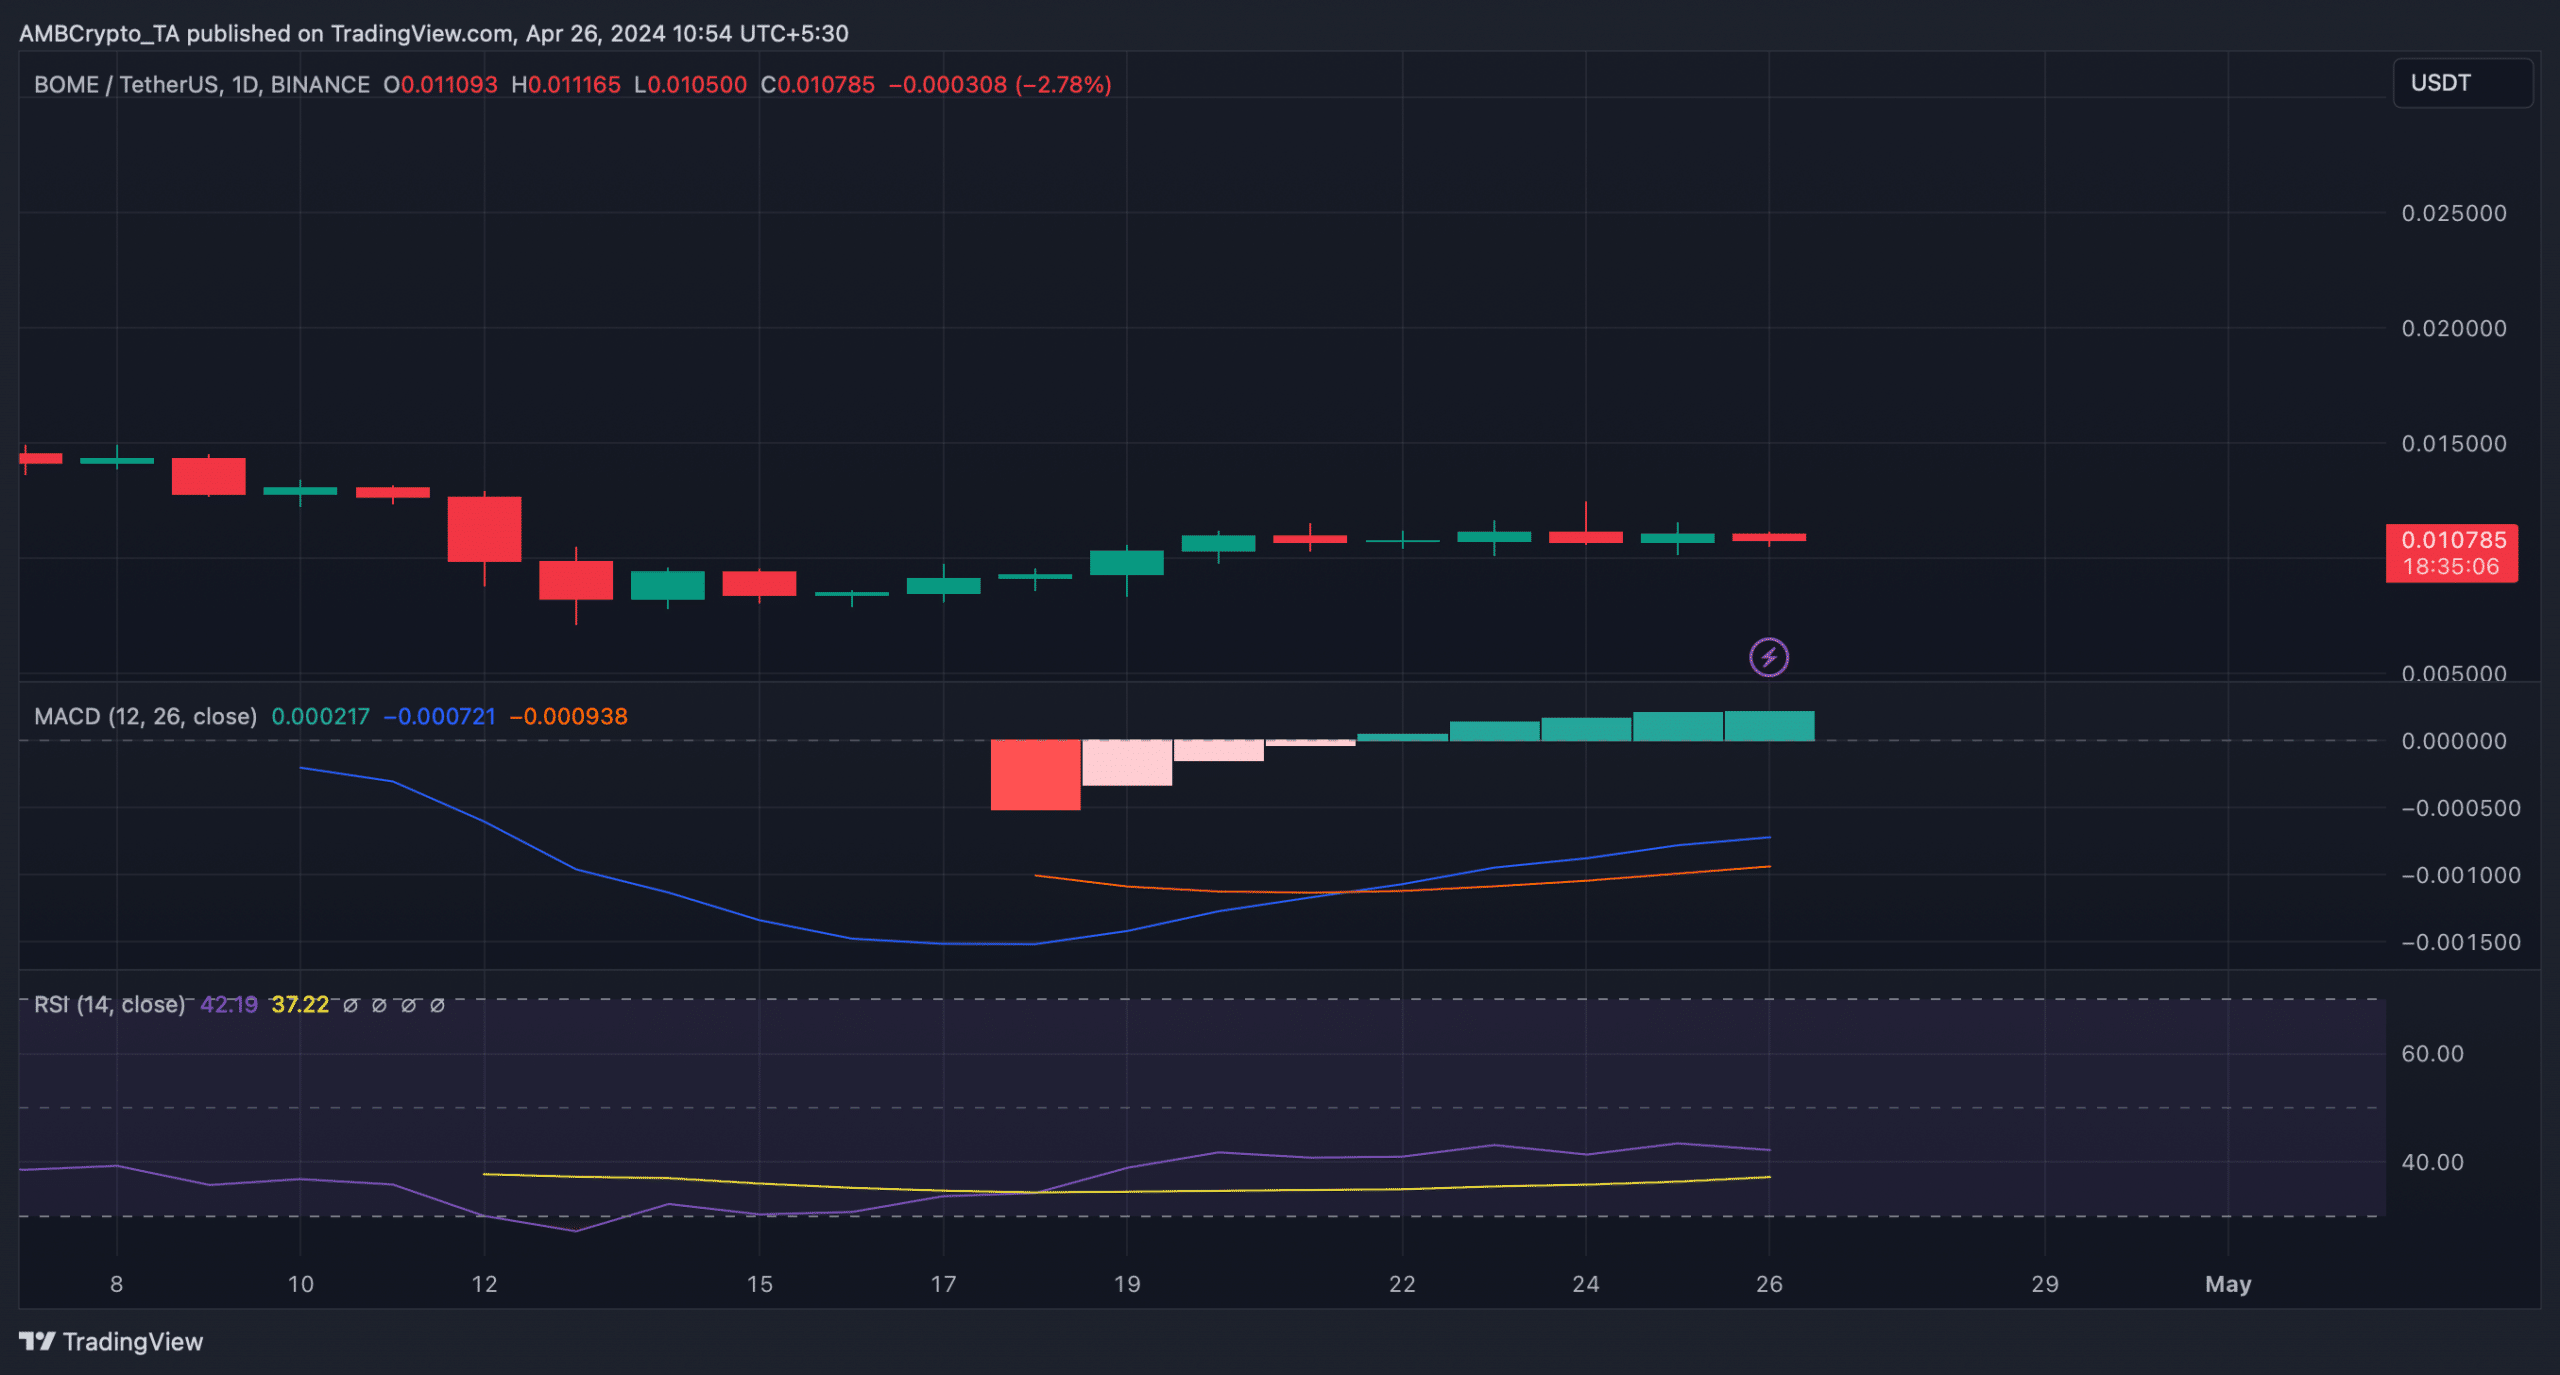
TradingView
Realistic or not? Here is the BTC market cap for BOME
. MEW price was above its 20-day Simple Moving Average (SMA) as indicated by Bollinger Bands. Money Flow Index was also above neutral, indicating a high probability of price increase in the near future.
However, Chaikin Money Flow Index (CMF) was bearish. It recorded a sharp decline.

TradingView[196537]