Polkadot’s RWAs Help DOT to a Weekly Gain of 11%

Financial Analyst
- DOT is up nearly 12% in the last 7 days
- Sustainable developments and RWA integrations have also changed the market sentiment
While most altcoins have seen major bouts of depreciation recently, a significant upswing is emerging on the DOT charts, according to crypto analyst Michael Van De Poppe. In fact, DOT is up 11.88% in the past week, making analysts optimistic about Polkadot’s future.
For his part, De Poppe is quite confident about the altcoin’s long-term trend. The analyst claims:
“$DOT is likely to follow Ethereum in its upward expansion. This means that Polkadot’s current valuations are extremely low. With all the new segments, I expect a lot from the Polkadot ecosystem.”
RWAs are driving market sentiment on DOT
One of the most notable factors behind DOT’s recent resilience is the adoption and integration of real-world assets. According to Esra Bulut’s post on X, RWAs are indeed at the heart of the current bullish outlook. She shared:
“Real World Assets (RWAs) are gaining momentum in the crypto space and @Polkadot $DOT is at the forefront of this trend with its innovative development. The Polkadot team’s integration of the RWA industry is groundbreaking and paves the way for a long-term bullish outlook.”
The integration fuels a positive market outlook for several reasons.
First of all, RWAs are growing and have significant market potential. Estimates suggest that RWAs will grow to $4-16 trillion by 2030. Therefore, DOT has tremendous potential in RWAs due to its scalability and security.
As RWAs in traditional markets look for reliable, secure, scalable, and affordable chains, Polkadot could be well positioned to flourish.
Is DOT on track for an uptrend?
Over the past 7 days, the altcoin has risen significantly on the price charts. The same was also evidenced by AskFX’s analysis which showed how the market trend changed from bearish to bullish due to a sudden price increase and a surge in buying pressure.
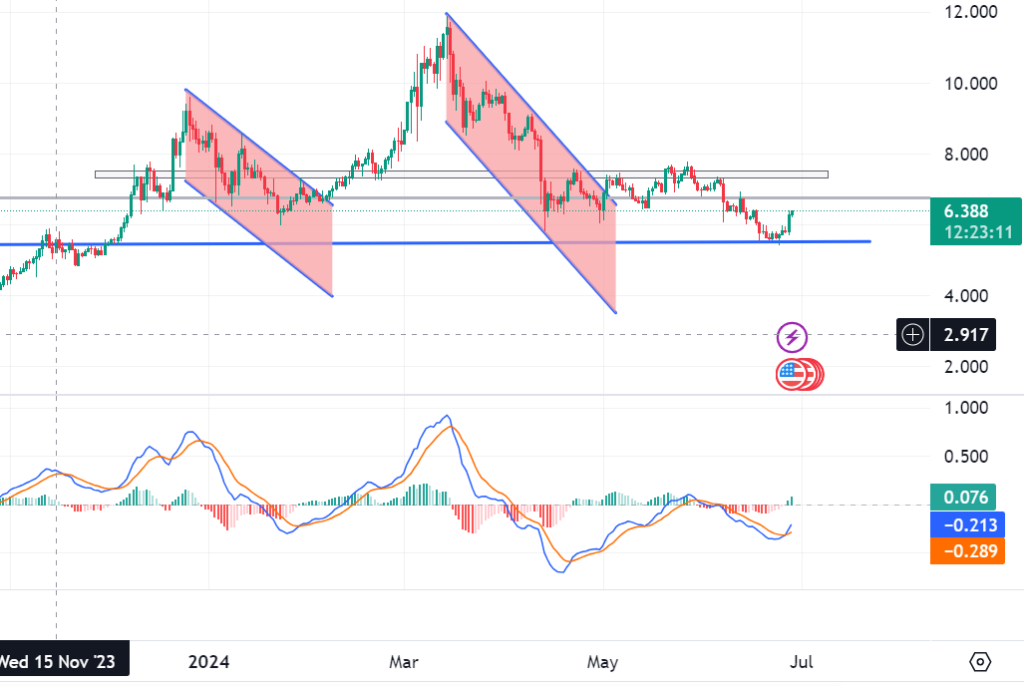
Source: Tradingview
AskFX’s analysis also revealed that DOT had a negative MACD and signal line while there was a positive histogram.
The positive histogram while MACD is above the signal line usually indicates the trend reversal and the start of the uptrend. Simply put, the bearish trend seemed to be fading with the market in the early stages of a bullish reversal.
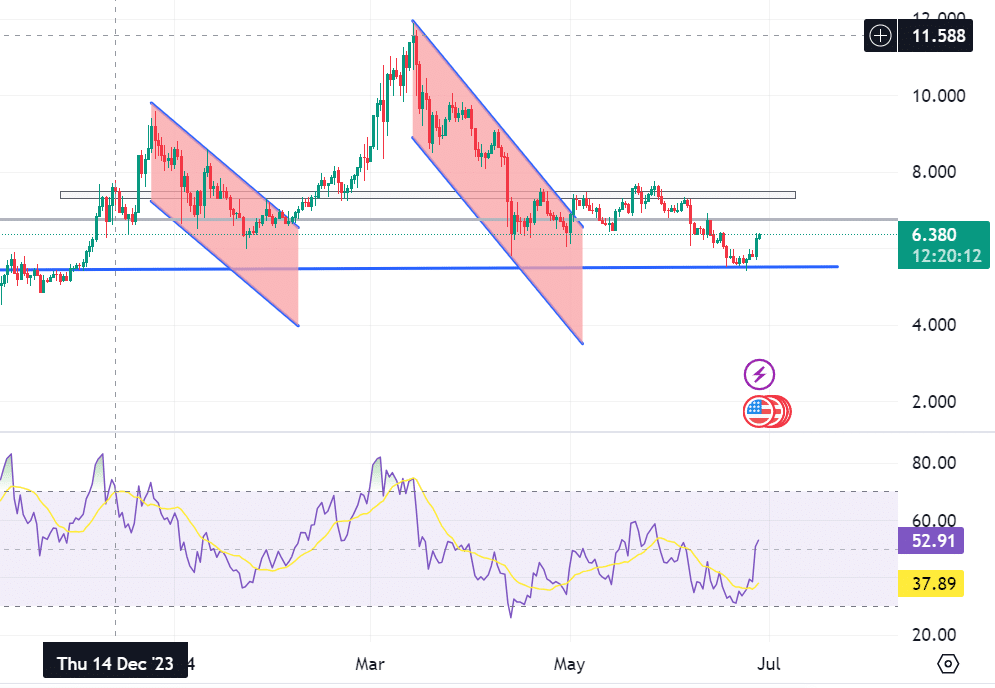
Source: Tradingview
Likewise, the RSI 51, which was slightly above the neutral level, highlighted the start of an uptrend. The RSI rose from 39 to 51 over the past 3 days, indicating a continued weakening of the bearish momentum.
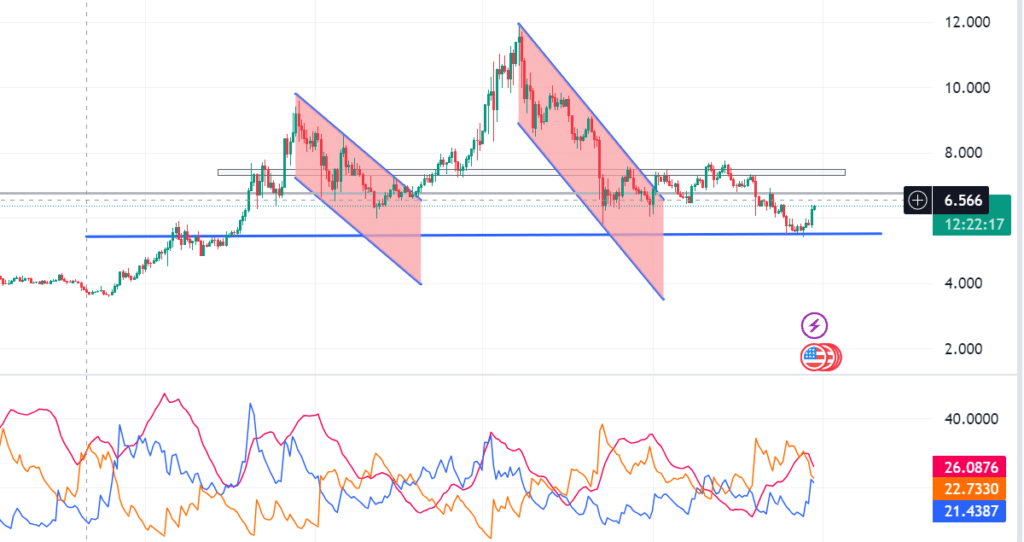
Source: Tradingview
the DMI indicated a bullish divergence, with a positive directional indicator rising from a low of 12.4 to a high of 21.
In fact, the negative directional indicator fell from a high of 33 to a low of 26 within 7 days. This meant that the bearish momentum was weak and the bulls may be pushing the market in their favor.
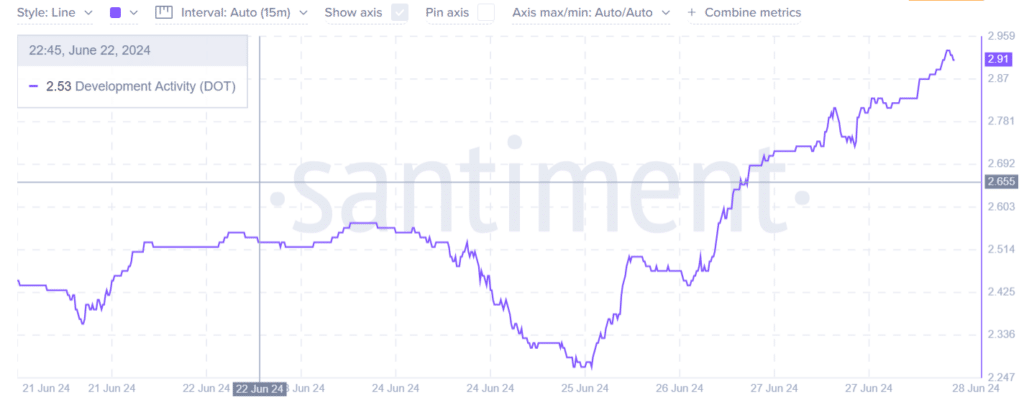
Source: Santiment
Here it is worth looking at other metrics as well. For example, in the last 7 days, development activity increased from 2.2 to 2.9. The increase in projects with tokenized RWAs can be interpreted as a sign of steady development of Polkadot, making it attractive to investors and traders.

Source: Coinglass
Coinglass highlighted falling liquidations for both short and long positions. Low liquidations indicate market stability, with investors holding their assets to sell them in the future.
There is little profit taking or sell-off, resulting in stability or confidence in the prevailing trend.