Price Watch – DOT – Will Polkadot Drop to $6.5?

Contributor
- Polkadot has seen a strong recovery over the past few weeks. Can bulls keep applying the pressure?
- The altcoin’s derivatives data showed a slight bullish bias.
Polkadot’s Recovery and Outlook
Polkadot’s recent recovery has brought the altcoin to a key inflection point, at the confluence of the 20-day and 50-day EMAs as well as the crucial $6.5 resistance level.
For nearly three weeks, DOT has been making higher lows on its daily chart, bouncing off its short-term trendline support. A potential close above or below this support level is likely to spark a volatile move in the coming weeks.
DOT was trading at around $6.2 at the time of writing, up around 0.5% over the past day.
Can DOT bulls spark a rally?
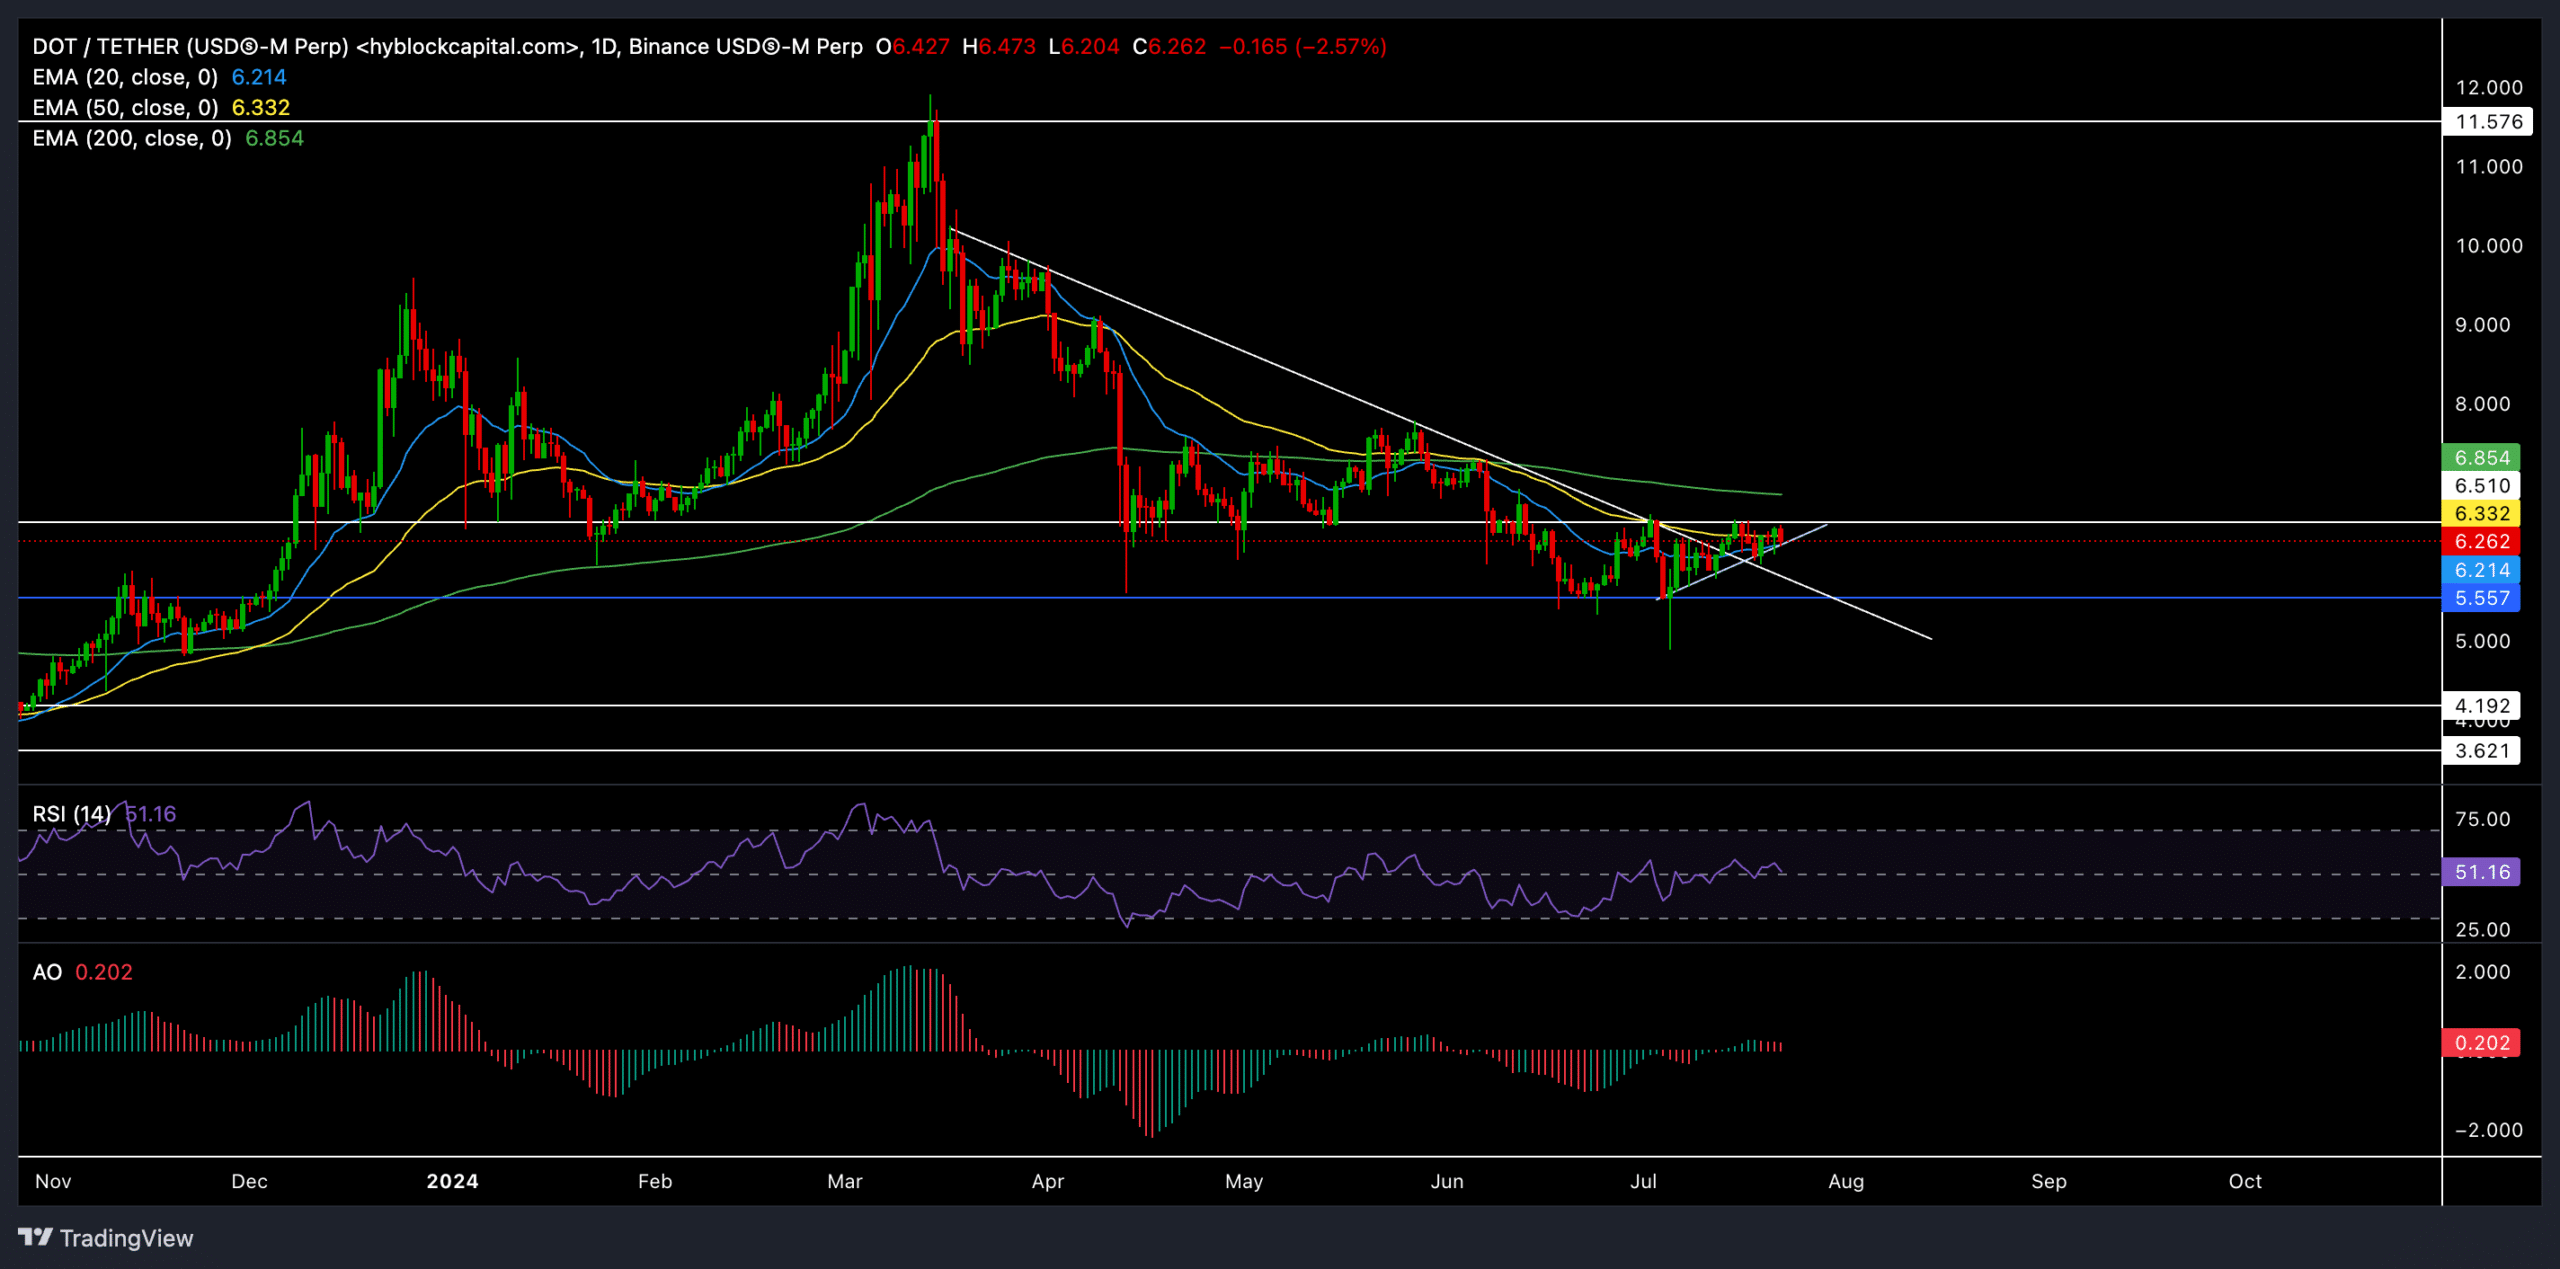
Source: TradingView, DOT/USDT
The reversal of the $11.5 resistance in March set the stage for bears to provoke a series of red candles. As a result, DOT lost almost 45% of its value in the last three months after hitting its two-year high in March.
DOT then found support near the $5.55 level, which the bears tested twice in the last month. It is worth noting that the altcoin fell below its crucial 20-, 50-, and 200-day EMA levels during this downturn.
However, the recent bounce from the $5.55 baseline has reignited some hopes of a recovery. DOT is up almost 13% in the last three weeks. Meanwhile, it also tested the $6.5 resistance several times, forming an ascending triangle-like structure.
Should the price close above the immediate resistance level at $6.5, it could trigger an immediate uptrend. The 200 EMA at $6.8 would be the first major resistance level in this case.
However, if the price breaks below the 20-day and 50-day EMAs, it could delay the immediate recovery prospects. In this case, DOT would likely bounce off the $5.55 level to retest the $6.5 resistance.
The Relative Strength Index finally found a close above the 50-day level, confirming an easing of selling pressure. However, buyers should wait for a sustained close above this level to gauge the chances of an uptrend in the coming days.
Similarly, the Awesome Oscillator closed above its equilibrium but saw some red lines on its histogram over the past few days.
Read Polkadot [DOT] Price Prediction 2024-2025
Derivatives Data Insights
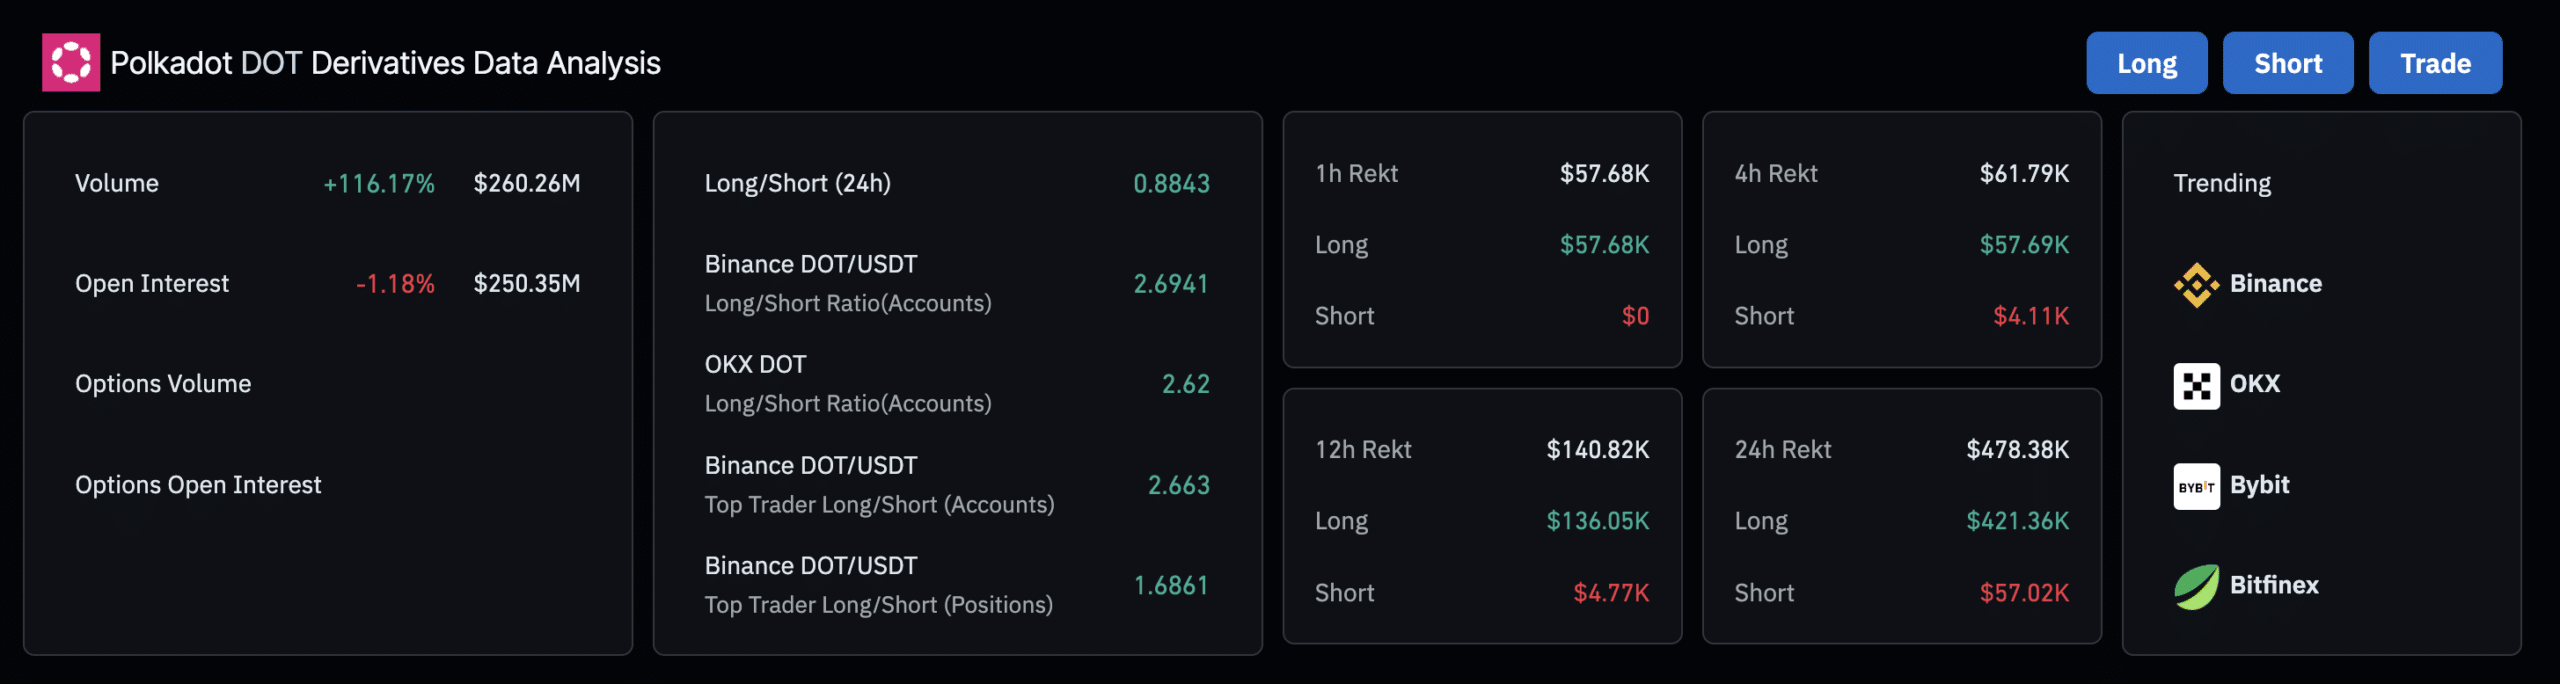
Source: Coinglass
Coinglass data showed a bullish sentiment among traders, especially on Binance and OKX. However, the overall market appears to be a bit more biased towards shorts over the past 24 hours.
Traders are now positioning for potential larger moves, with a slight preference for longs. However, it is important to consider Bitcoin and the overall market sentiment before making any trading decisions.