Solana Hits $145 But Signs Point to a Price Correction – Here’s Why

![]()
Journalist
- FOMO around Solana has increased significantly in the past few days.
- Fear and Greed Index suggested a price correction
Solana [SOL] investors cheered after several days of bearish price action as the token’s weekly and daily charts turned green. However, investors must continue to exercise caution as FOMO around the token could put an end to this recently initiated bull rally.
Solana investors rejoice in gains
Data from CoinMarketCap showed that Solana’s price has increased by more than 9% in the past seven days. In the past 24 hours alone, the token’s value increased by over 4%, reaching $145 again.
However, at press time, SOL’s price was undergoing a slight correction and was trading at $144.8 with a market cap of over $67 billion.
Thanks to the recent price increase, the market sentiment around the coin has turned optimistic, which was evident from the massive increase in weighted sentiment.

Source: Santiment
Although the above data looked optimistic, Santiment’s recent tweet pointed out a development that could cause trouble for Solana.
According to the tweet, while SOL price was gaining bullish momentum, FOMO around it was also increasing. Generally, a rise in FOMO amidst a price increase often ends the bull run.
It was interesting to know that Avalanche [AVAX] also showed an upward rally along with SOL. The good news for AVAX was that FOMO around it did not increase much.
Will SOL’s bull rally continue?
With there being a possibility that SOL’s bull rally may end, AskFX checked its on-chain data to better understand what to expect.
Our analysis of Coinglass’ data showed that SOL’s long/short ratio has increased. An increase in the metric is usually considered a positive signal as it indicates that bullish sentiment around an asset is high.

Source: Coinglass
However, Solana’s Fear and Greed Index was at 63% at press time, meaning the market was in a “greed” phase. Whenever the value hits this level, it indicates that the chances of a price correction are high.
The Bollinger Bands showed that SOL price was entering a less volatile zone. Moreover, the Relative Strength Index (RSI) recorded a decline after a sharp increase, suggesting that Solana may see a price pullback soon.
The Chaikin Money Flow (CMF), on the other hand, continued to move north. The MACD showed a clear bullish crossover, suggesting a continued price increase.

Source: TradingView
Is your portfolio in the green? Check out the SOL Profit Calculator
Our analysis of Hyblock Capital data found that it would not be surprising to see SOL rise above $150 in the coming days if the bull rally continues.
However, a correction could lead to a drop to $141.
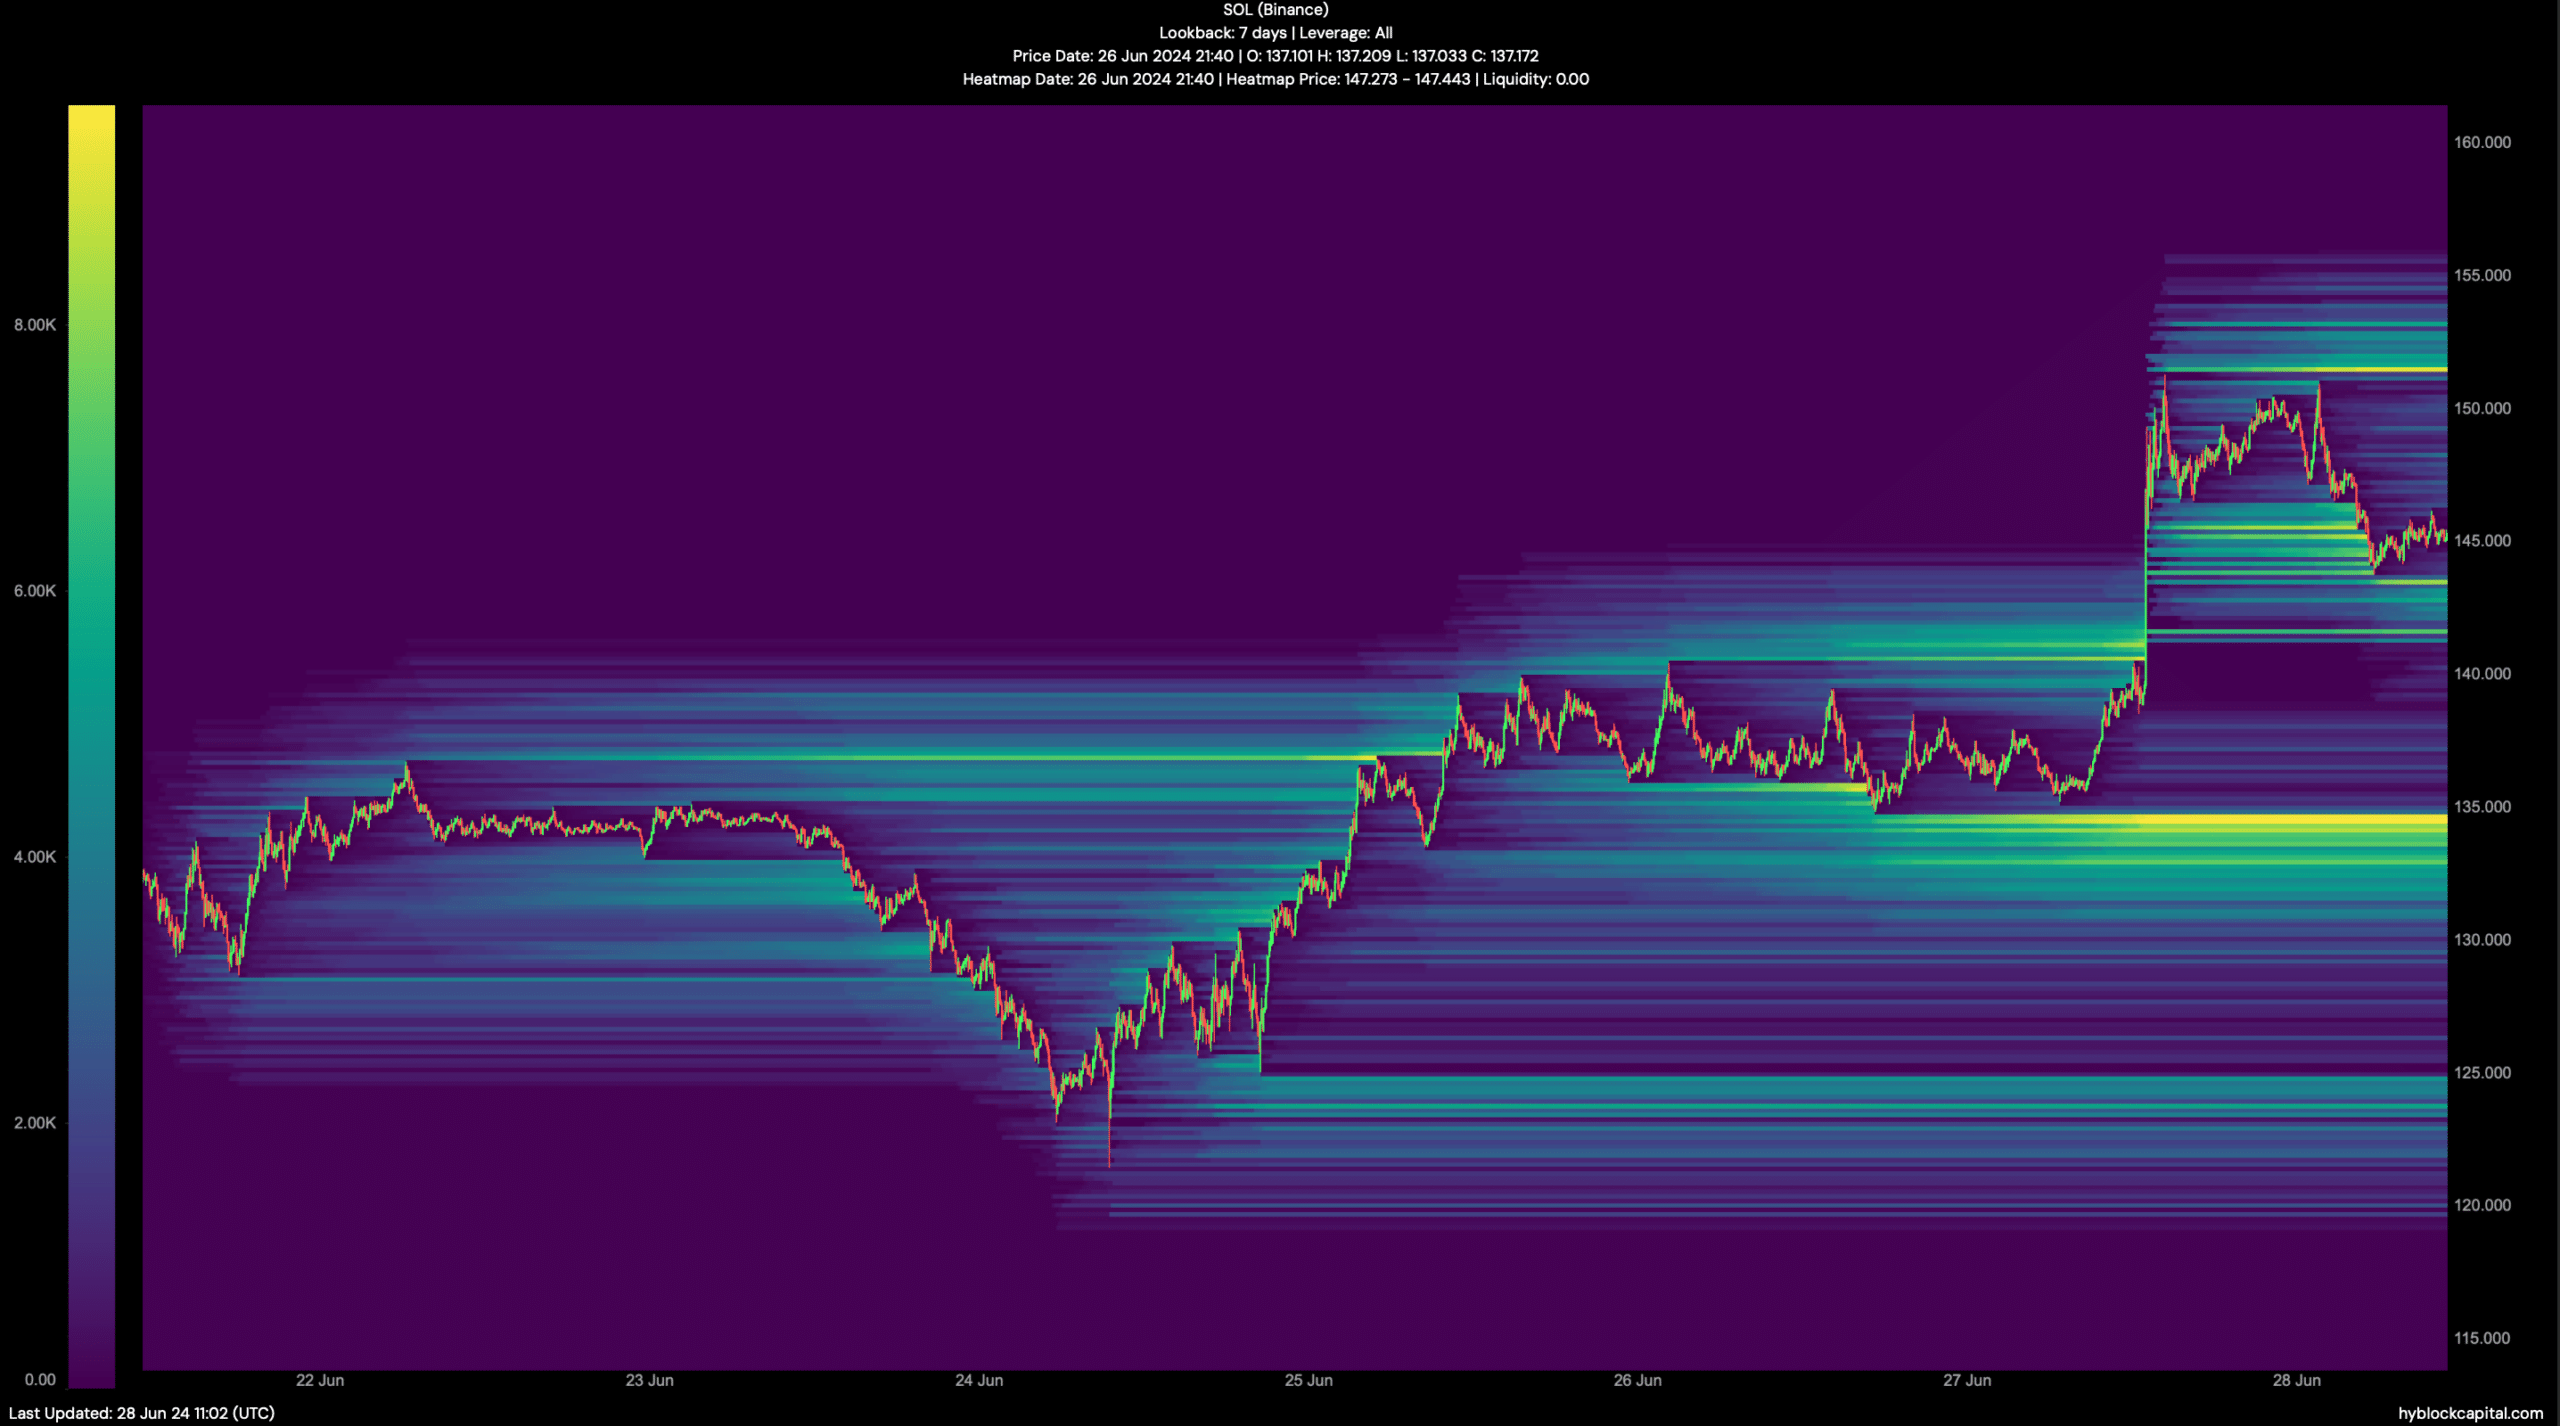
Source: Hyblock Capital