Solana Peaks for May 2022; Is This Good News for SOL Investors

Journalist
- Solana’s TVL is at its highest level in 22 months.
- Key technical indicator points to the increase in bearish activity in the SOL market.
Solana’s [SOL] Decentralized Finance (DeFi) Total Value Locked (TVL) has reached its highest level since May 2022, according to DefiLlama’s data.

Source: DefiLlama
At press time, the TVL of the Layer 1 (L1) network was $4.03 billion, up 97% in 30 days. According to DefiLlama’s rankings, Solana is the only blockchain among the top 10 DeFi networks whose TVL has increased by this much in the last 30 days.
Solana’s Total Value Locked Reaches Highest Level in 22 Months
Recent data shows an increase in user demand and activity on the Solana network, leading to a surge in Total Value Locked (TVL).
According to The Block’s data dashboard, the monthly number of new addresses on Solana has risen to an all-time high, with the number of unique first signers transacting on the network totaling 16.32 million in the last 21 days.
Additionally, there was a significant increase in active addresses this month, with the number reaching 22.19 million, the highest level since July 2022.
The surge in users has resulted in an increase in transaction fees, with total fees reaching $5.08 million as of March 18, marking a new multi-month record.
Protocol revenue from transaction fees also hit an all-time high of $2.5 million in a single day, indicating strong network usage. While demand for SOL is slowing, bearish sentiment is on the rise.
According to CoinMarketCap
Market Trends and SOL Demand
Despite the recent market decline, SOL continues to see high demand, with momentum indicators showing strong preference for accumulation over distribution.
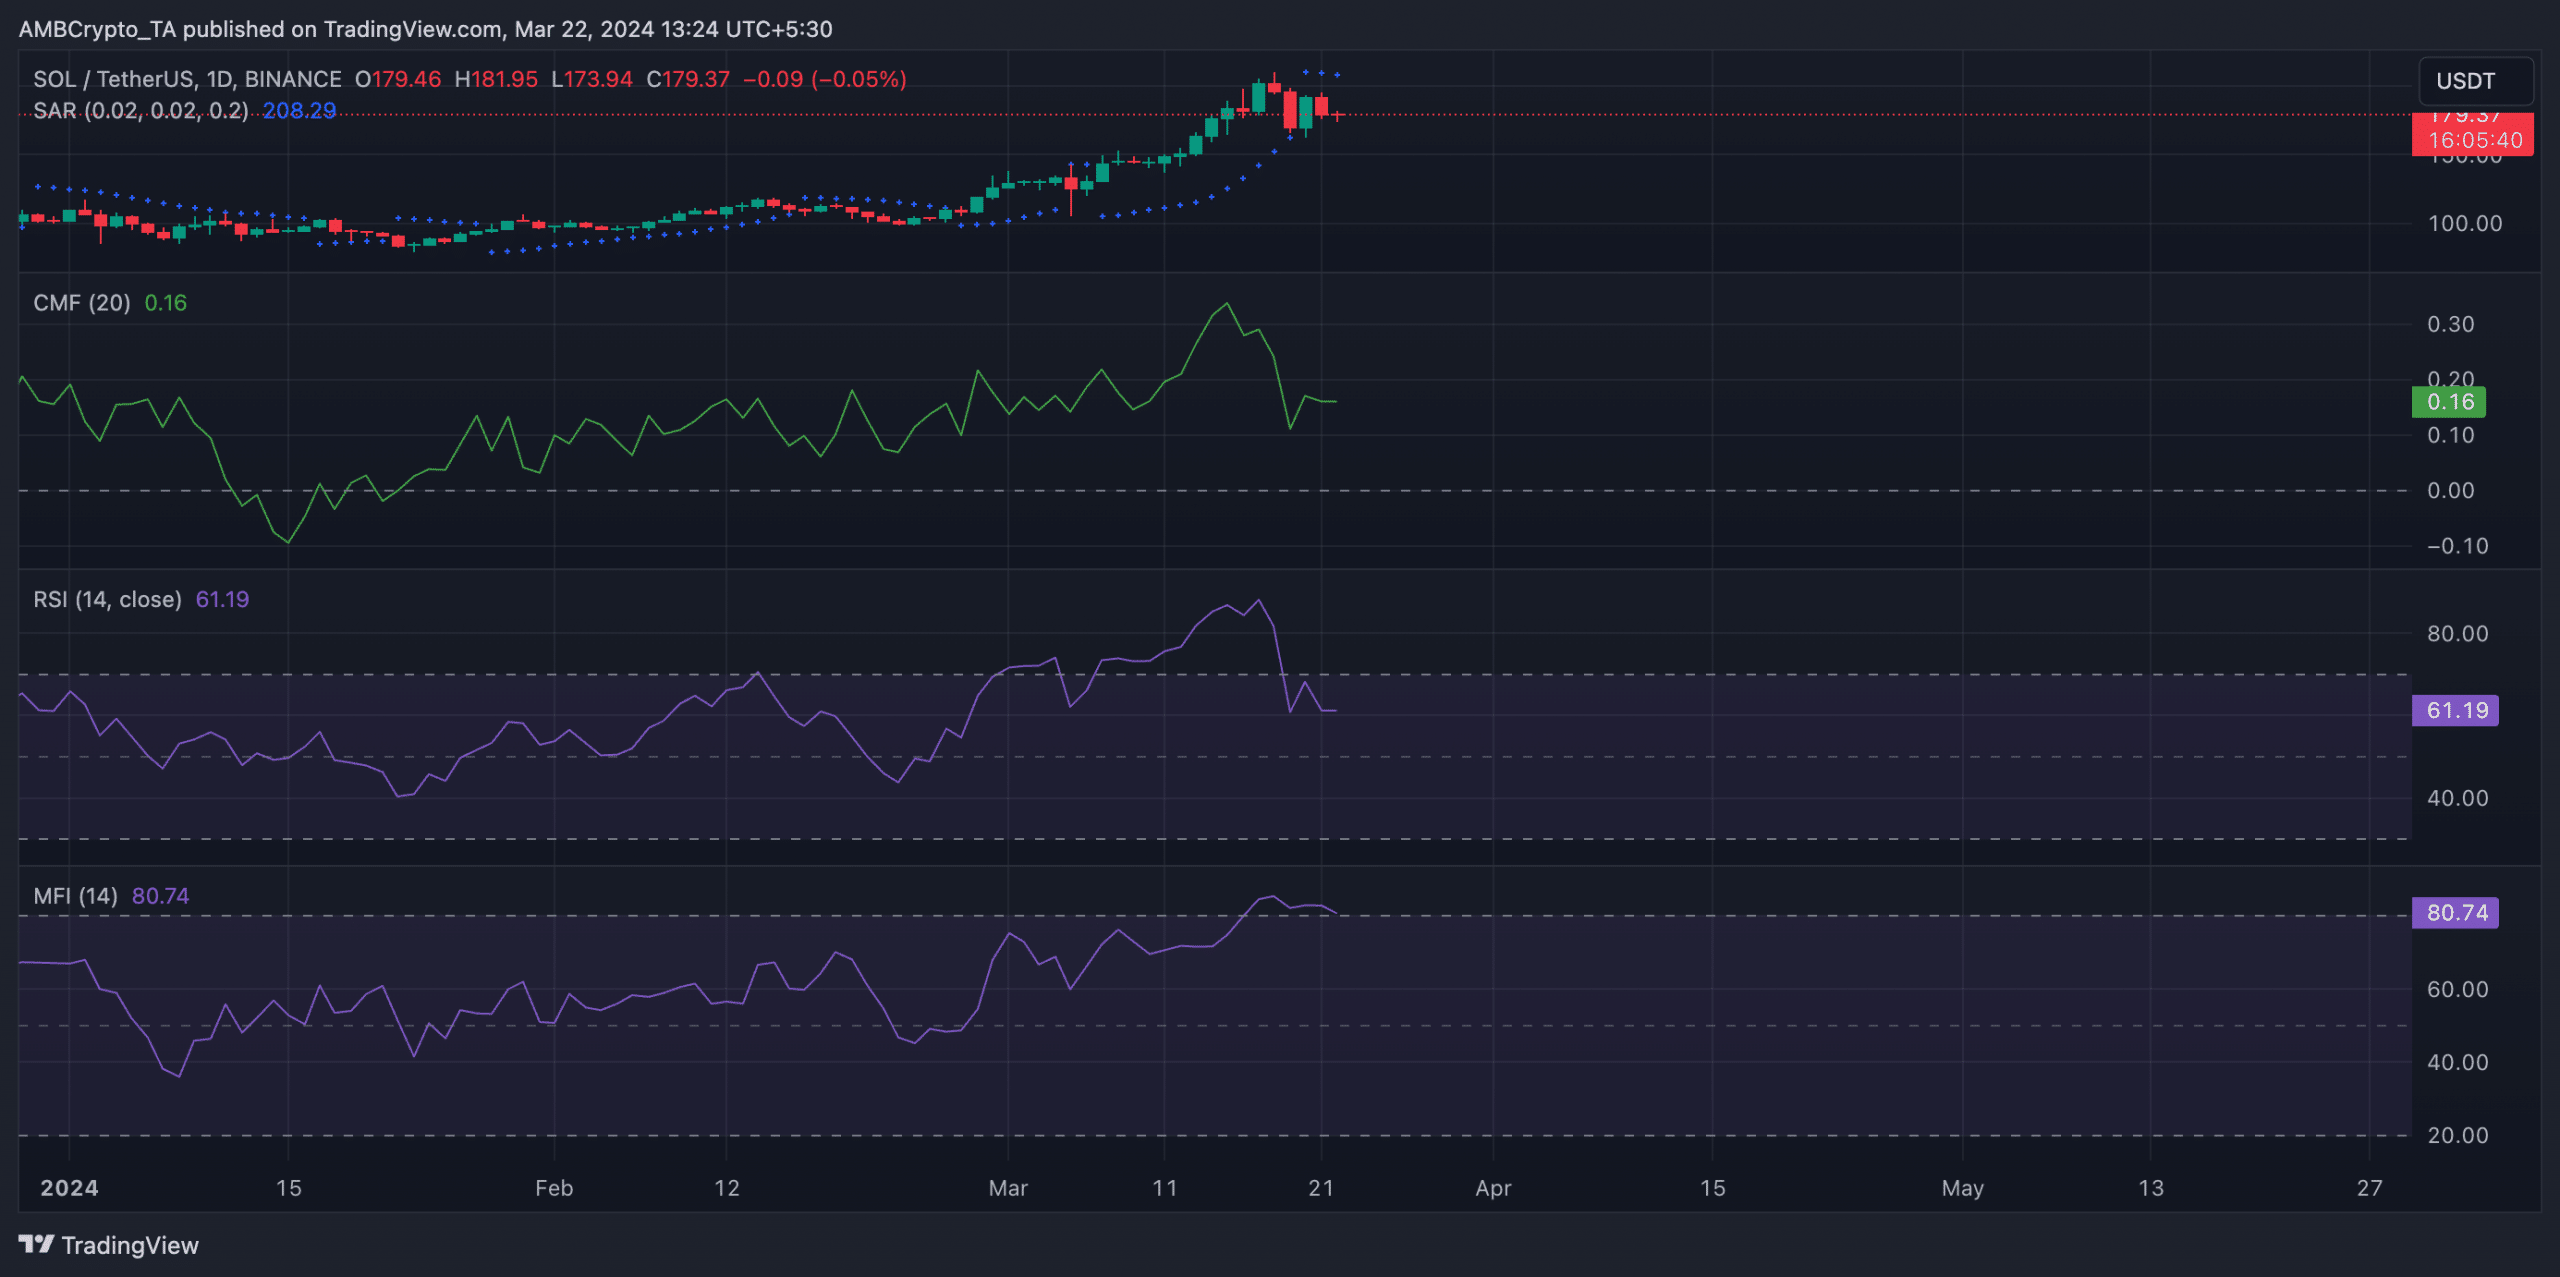
Current indicators, such as SOL’s Relative Strength Index (RSI) at 61.19 and Money Flow Index at 80.74, suggest favorable conditions for SOL trading. Additionally, positive Chaikin money flow values indicate liquidity flowing into the SOL markets, with a CMF value of 0.16 at the time of writing.
The parabolic SAR (Stop and Reverse) indicator, however, reflects a decline in bullish sentiment and a growing bearish activity in the market, signaling potential trends and reversals for traders to consider.
TradingView