Solana’s Surge to $176 Could Trigger $3 Billion in Liquidations. Here’s Why

Cryptocurrency Analyst
- Solana’s price has increased by over 5% in the last 24 hours.
- Several metrics and indicators pointed to a price correction.
Like most other cryptocurrencies, in Solana too, bulls have managed to keep control of the market for several days. [SOL] Although this indicated further price growth, SOL may soon face an obstacle even if bulls dominate. Let’s find out what’s going on.
Solana remains bullish, but…
Latest Market Data
has shown that SOL’s price increased by over 12% last week. In the last 24 hours alone, the token’s value increased by more than 5%. At the time of writing, SOL was trading at $161.26 and had a market cap of over $74.8 billion, making SOL the fifth largest cryptocurrency.
In fact, AskFX
reported earlier that Captain Faibik, a well-known crypto analyst, posted a tweet announcing that he expects SOL to hit $1,000 this bull cycle. According to our analysis of Santiment’s data, SOL’s trading volume increased last week along with its price. This can be interpreted as a bullish signal as increasing volume serves as a basis for a sustained price increase.
However, the weighted sentiment has dropped, meaning that the pessimistic sentiment around the token is increasing in the market.
Santiment was the source
SOL was in for more trouble. Ali, a well-known crypto analyst, tweeted
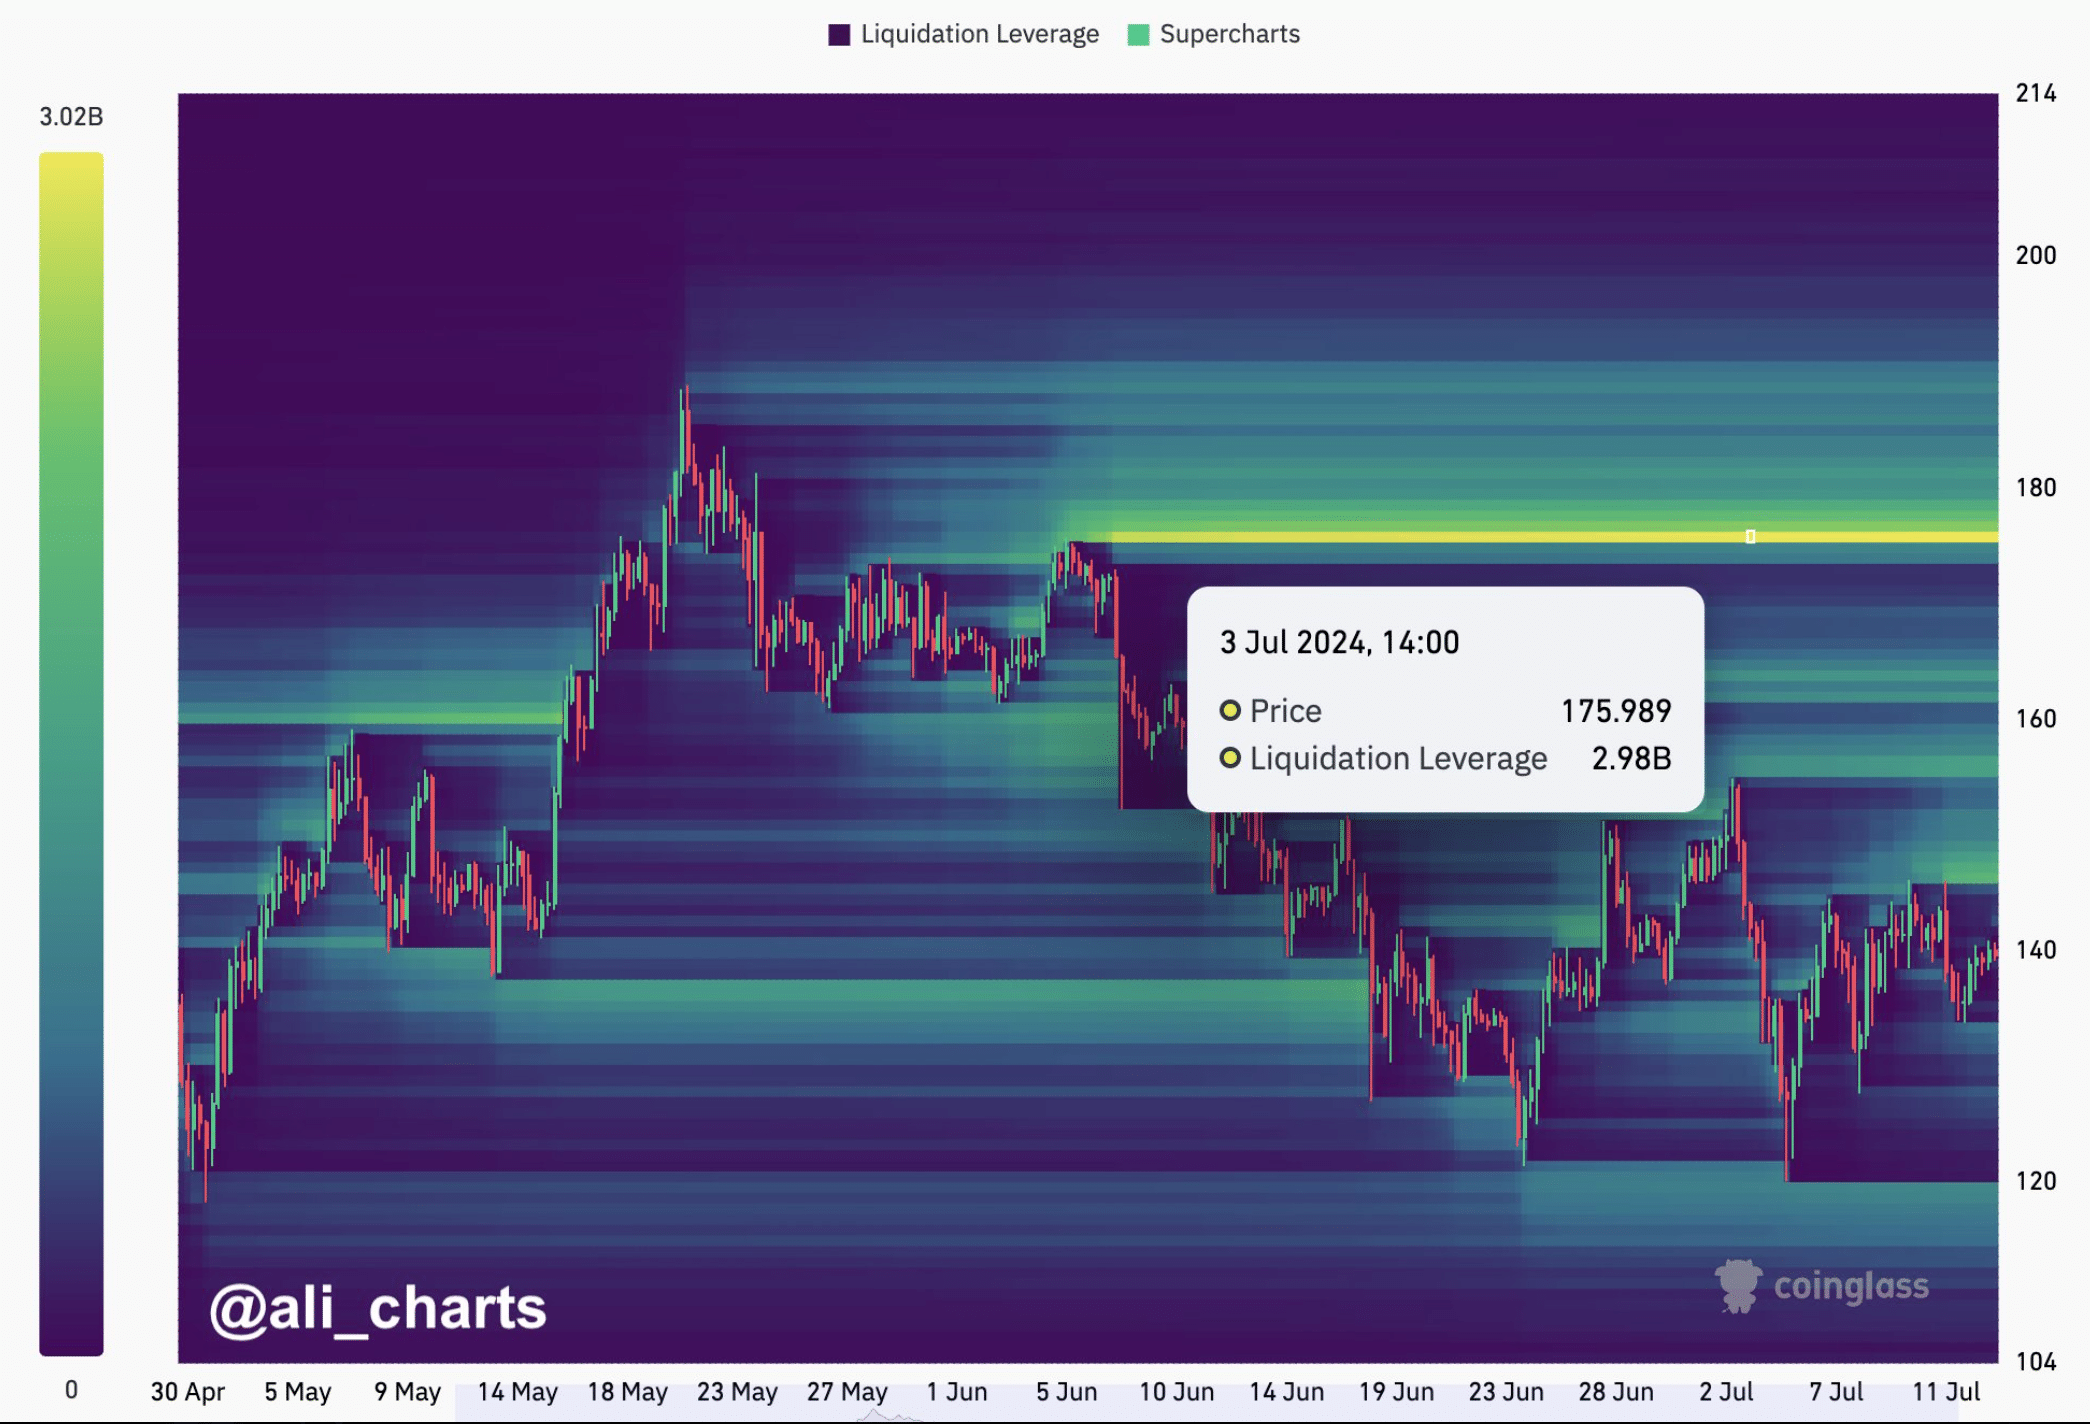
about an interesting development. Notably, $2.98 billion worth of short positions will be liquidated when SOL rises to $176. When liquidation increases during a bull run, it generally leads to a price correction that is short to medium term. Solana needs to break above this level for its bull run to continue and reach $1,000 in the long term.
Source: X.
SOL’s path forward.
Further Analysis
Prices tend to move in the opposite direction of the funding rate. This suggested that SOL could experience a price correction before it hits $176, which would see more than $2 billion liquidated.
Coinglass data showed that Solana’s long/short ratio has declined. This suggests that bearish sentiment is increasing in the market as more short positions are being opened.
Coinglass
Apart from that, at press time, SOL’s
Fear and Greed Index showed that the market had entered a phase of “extreme fear.” When the metric hits this level, it usually indicates that a price correction is imminent. Is your portfolio in the green? SOL Profit Calculator.
We then analyzed the daily chart of SOL and analyzed the indicators that suggested that SOL would reach $176. SOL prices had already reached the upper border of the Bollinger Bands
. The Chaikin Money Flow or CMF also showed a downtrend. This indicated a possible price drop. However, the MACD continued to support the bulls.
TradingView


