The Weekly Winners and Losers of the Crypto Market – NOT, MANTRA, FTM, PENDLE

Crypto Market Winners and Losers – NOT, MANTRA FTM, PENDLE 19459000
- Last week, the three biggest winners were MANTRA MultiversX and Notcoin.
- Last week’s biggest losers were ORDI Pendle and Fantom.
Mantra is the top gainer of last week. Pendle, on the other hand, struggled and remains in the losers list.
Biggest Gainers
Mantra (OM)
MANTRA(OM) was the only cryptocurrency to see a significant gain in a week marked by general declines in the crypto market.
CoinMarketCap reports that OM is up 25.05% over the last week, making it the biggest gainer. Analysis of price action showed that OM started the week at $0.7 and gained momentum throughout the week.
It closed the week above $0.8, despite some minor declines that briefly pushed the price below its starting point.
OM’s price continued to rise at the beginning of the week and is currently trading at around $0.9. OM’s market cap has also increased significantly. It now stands at over $765 million, up 8% in the last 24 hours.
The company’s trading volume has dropped by more than 20% to approximately 32.3 million.
MultiversX (EGLD).
MultiversX (EGLD)’s performance was the second best in the market, with data from CoinMarketCap showing a 20.66% increase at the end of the week.
Despite some fluctuations, analysis of EGLD’s price trend showed that it started trading at around $28.8 at the beginning of the week and ended at around $35. The asset showed more uptrends than downtrends throughout the week.
EGLD’s price fluctuations were characterized as sharp spikes. This was a prominent feature of the weekly trading pattern. At the time of writing, the price was around $34.1.
EGLD’s market cap has increased by 2% in the last 24 hours, to $927 million. It is also important to note that its trading volume has dropped by almost 50%, and is now just over $34 million.
Notcoin
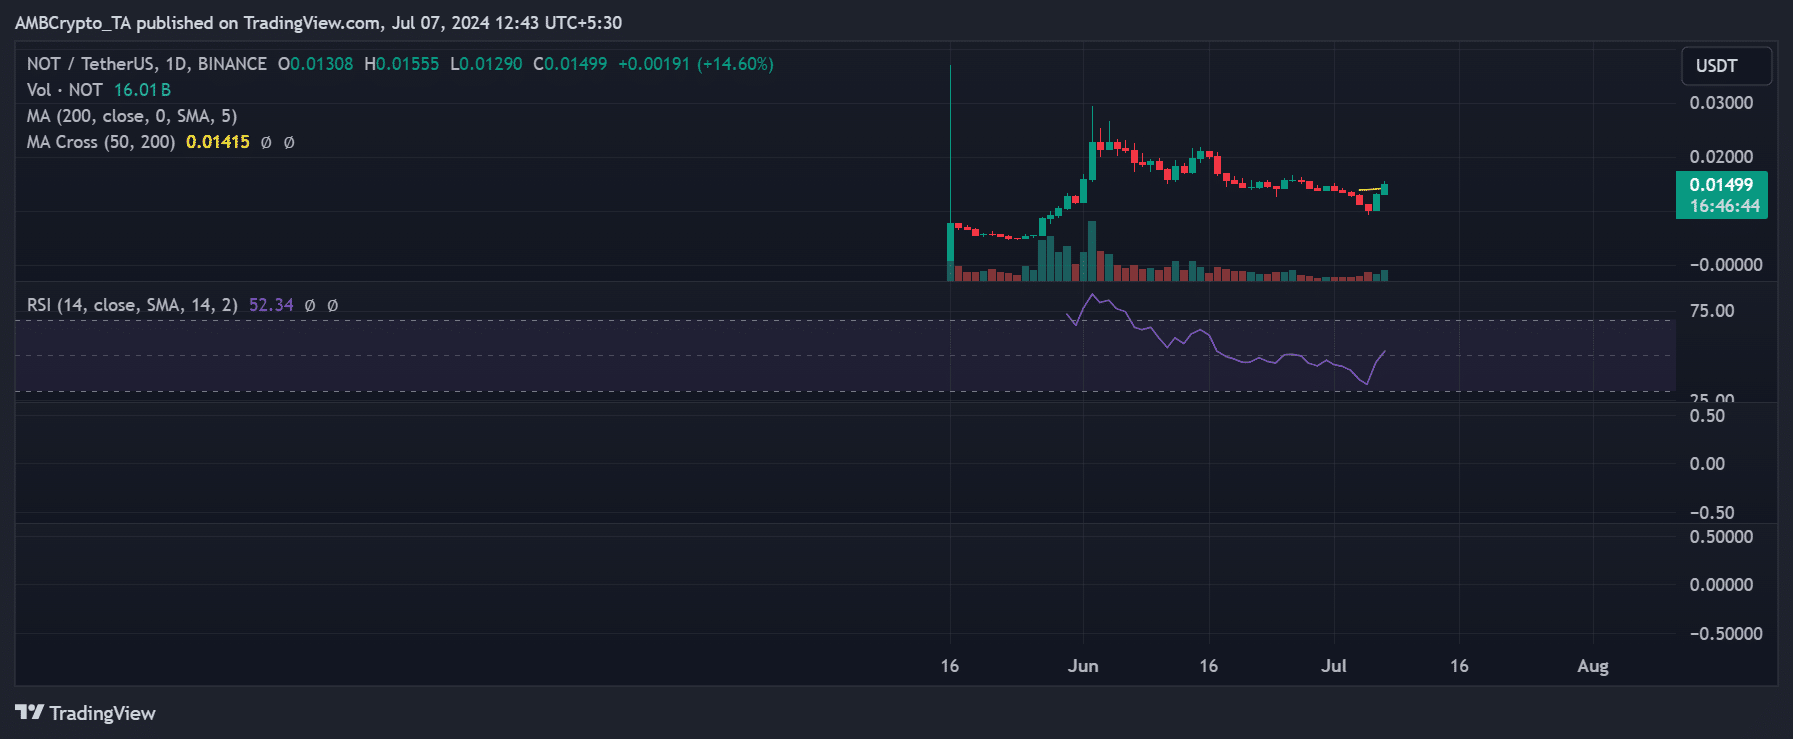
Notcoin (NOT), the second cryptocurrency added, initially recorded only a few digits of gain.
NOT’s price chart showed that the currency started the week at $0.014, with a gain of almost 6%. Then, it experienced a series of declines in the next trading sessions. By July 5, its price had fallen by more than 9%. The coin’s price was at $0.010 at the end of that day’s trading session.
A major rally at the end of last week changed its fate drastically. NOT’s price rose by 28.61% and managed to return to the winners’ charts. It closed the week at around $0.013.

TradingView
As of this writing, NOT is trading at $0.014, another increase of over 15%. This recovery coincides with a dramatic increase in trading activity. Volume has increased by over 150% in the last 24 hours to over 877 million.
Its market cap also grew by over 44% to reach over $1.5 billion. It was the only asset among the top three gainers with a market cap of at least $1 billion.
Biggest Losers
ORDI
ORDI (ORDI) experienced a major downturn last week, according to CoinMarketCap. It topped the list of losers with a 23.26% drop.
Data showed that ORDI started the week at a price of $38 and steadily fell from there. Around July 5, its price dropped from around $32 to around $27.
Despite a small recovery in the second half of the week, ORDI’s closing price was around $30.70, which was not enough to take it off the losers list. At the time of writing, it was still trading in the $30 range.
ORDI’s market cap has increased slightly by more than 4%. This suggests that there may be some buying interest despite the recent price declines.
Trading volume has declined by more than 28% to around $124.3 million.
Pendle
Pendle (PENDLE), which has suffered significant losses for the second week in a row, continues to struggle in the market. With a drop of 22.45%, it was the second biggest loser in the market.
PENDLE started the week at around $5 and initially tried to make some small gains.
It soon entered a downward spiral and continued to decline throughout the week, eventually closing at around $4.
PENDLE dropped to around $3.80 at the start of the week.
The company’s market cap has increased slightly in the last 24 hours and now exceeds $592 million, an increase of more than 1%.
PENDLE’s trading volume is around $65 million, a decrease of almost 10%.
Fantom
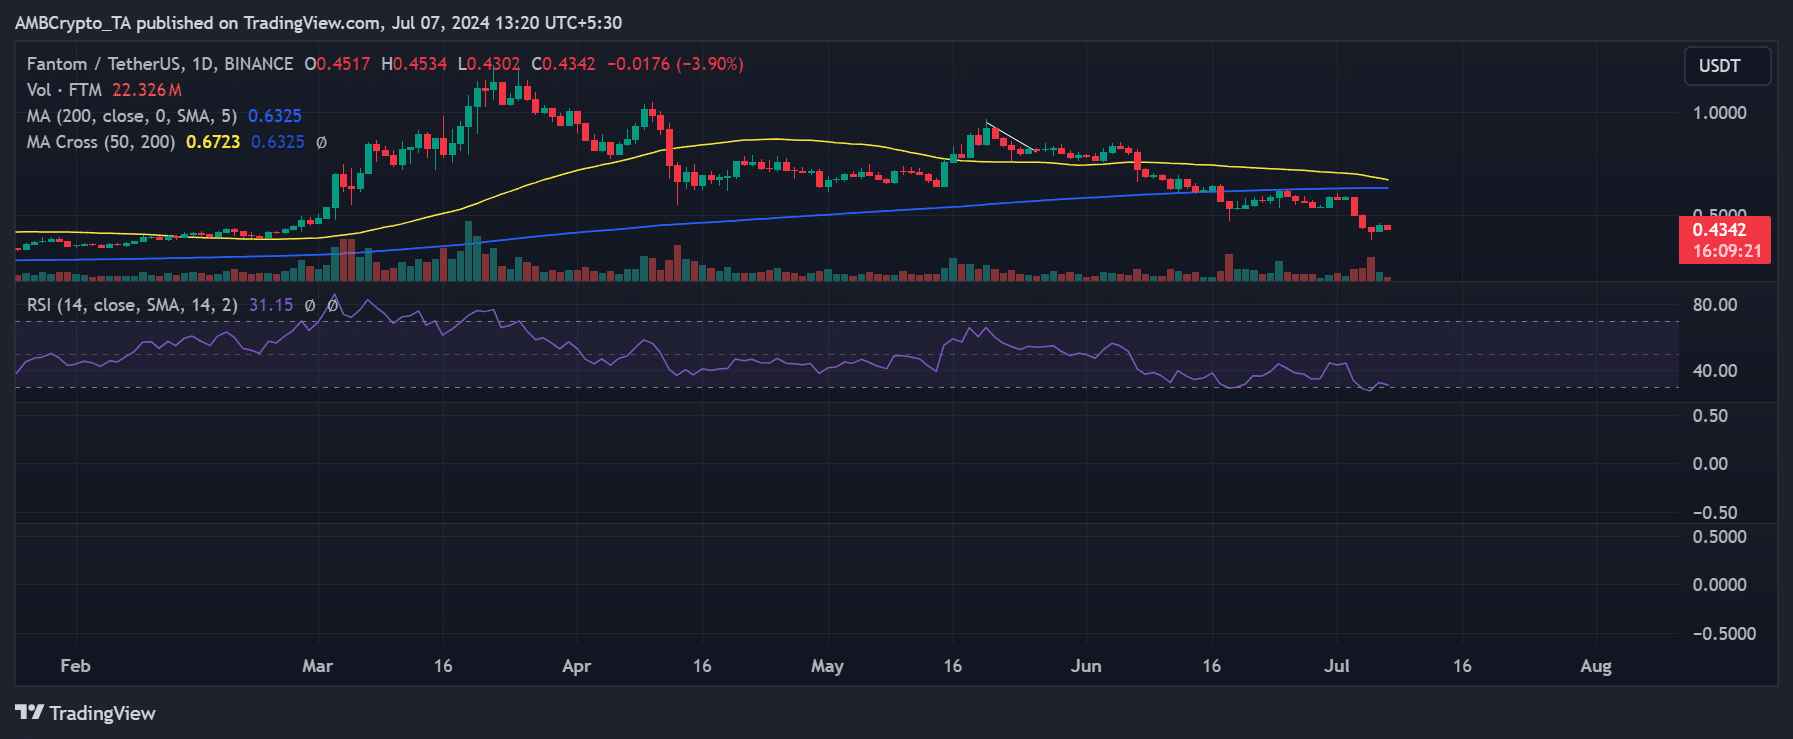
Fantom (FTM) daily analysis revealed that the coin started off positively last week, trading at $0.58, up 8.80%.
The asset’s price dropped to $0.44 on July 3 and 4, after suffering losses of 14.71% and 11.53%, respectively.
FTM’s price reached $0.45 by the end of the day, a modest increase of 6.41%. However, more work was needed to recover the losses.

TradingView
CoinMarketCap reports that Fantom ended the week as the third biggest loser with a total loss of 20.95%.
The market cap was around $1.2 billion, reflecting a loss in value. Trading volume also decreased, totaling $118.6 million, indicating reduced trading activity.


