What Metrics Suggest That Cardano Will Repeat Its Market Trend in 2019? The Metrics Say
Market Analysis
- After a sharp correction, ADA’s price rose over 1.5% in 24 hours
- The metrics looked bullish but market indicators suggested otherwise
Cardano [ADA] saw a sharp price correction last week that pushed the token’s price down to $0.42. However, the scenario changed in the last 24 hours as the daily chart turned green. Ergo, the question: does this indicate the start of a bull rally? One that Cardano has been planning for several weeks?
Cardano is following a historical trend
ADA did not start May well as bears took control of the token’s price. However, that changed soon after as the cryptocurrency rose almost 2% and was trading at $0.4677 with a market cap of over $16.6 billion at press time.
Well, while this may not seem optimistic at first glance, there is more to the story. Ali, a well-known crypto analyst, recently shared a tweet highlighting how ADA is mimicking its 2019 price action. According to it, the altcoin consolidated within a parallel channel, signaling an end to the 2019 bear market.
Back then, Cardano broke out of the channel with a 75% surge, followed by a 56% price correction that set the market up for a massive 4,095% bull run.
It seems that ADA has started behaving similarly in 2023, with the cryptocurrency consolidating within a parallel channel before breaking out with a 72% surge. When the altcoin finally completes its correction on the charts, it is safe to expect ADA to start another bull rally. When that happens, the cryptocurrency will soon reach new heights.
Since the probability of a massive rally is high, this could be the right time to accumulate. And yet, the total number of Cardano holders remained unchanged over the past three months – a sign that new investors have not been buying ADA.
Source: Santiment.
Market Metrics – what do they say?
AskFX analyzed Santiment’s data to see if metrics suggested history is repeating itself. The MVRV ratio was a bullish metric as it showed a sharp increase. Whale activity around the token was also high last week. Open interest in Cardano increased along with the token’s price, a sign that an uptrend may continue.
Santiment
However, unlike the above metrics, most technical indicators seemed bearish. The Money Flow Index, for example, saw a sharp decline. The Chaikin Money Flow (CMF), a measure of Chaikin Money Flow, also showed a similar pattern.
They suggested that ADA may not be able to launch a massive rally in the near future.
ADA’s BTC market cap is realistic or not.
The MACD, on the other hand, showed a positive crossover. A bull rally will put more investors in a stronger position. According to IntoTheBlock, only 35% of ADA investors had profited at press time.
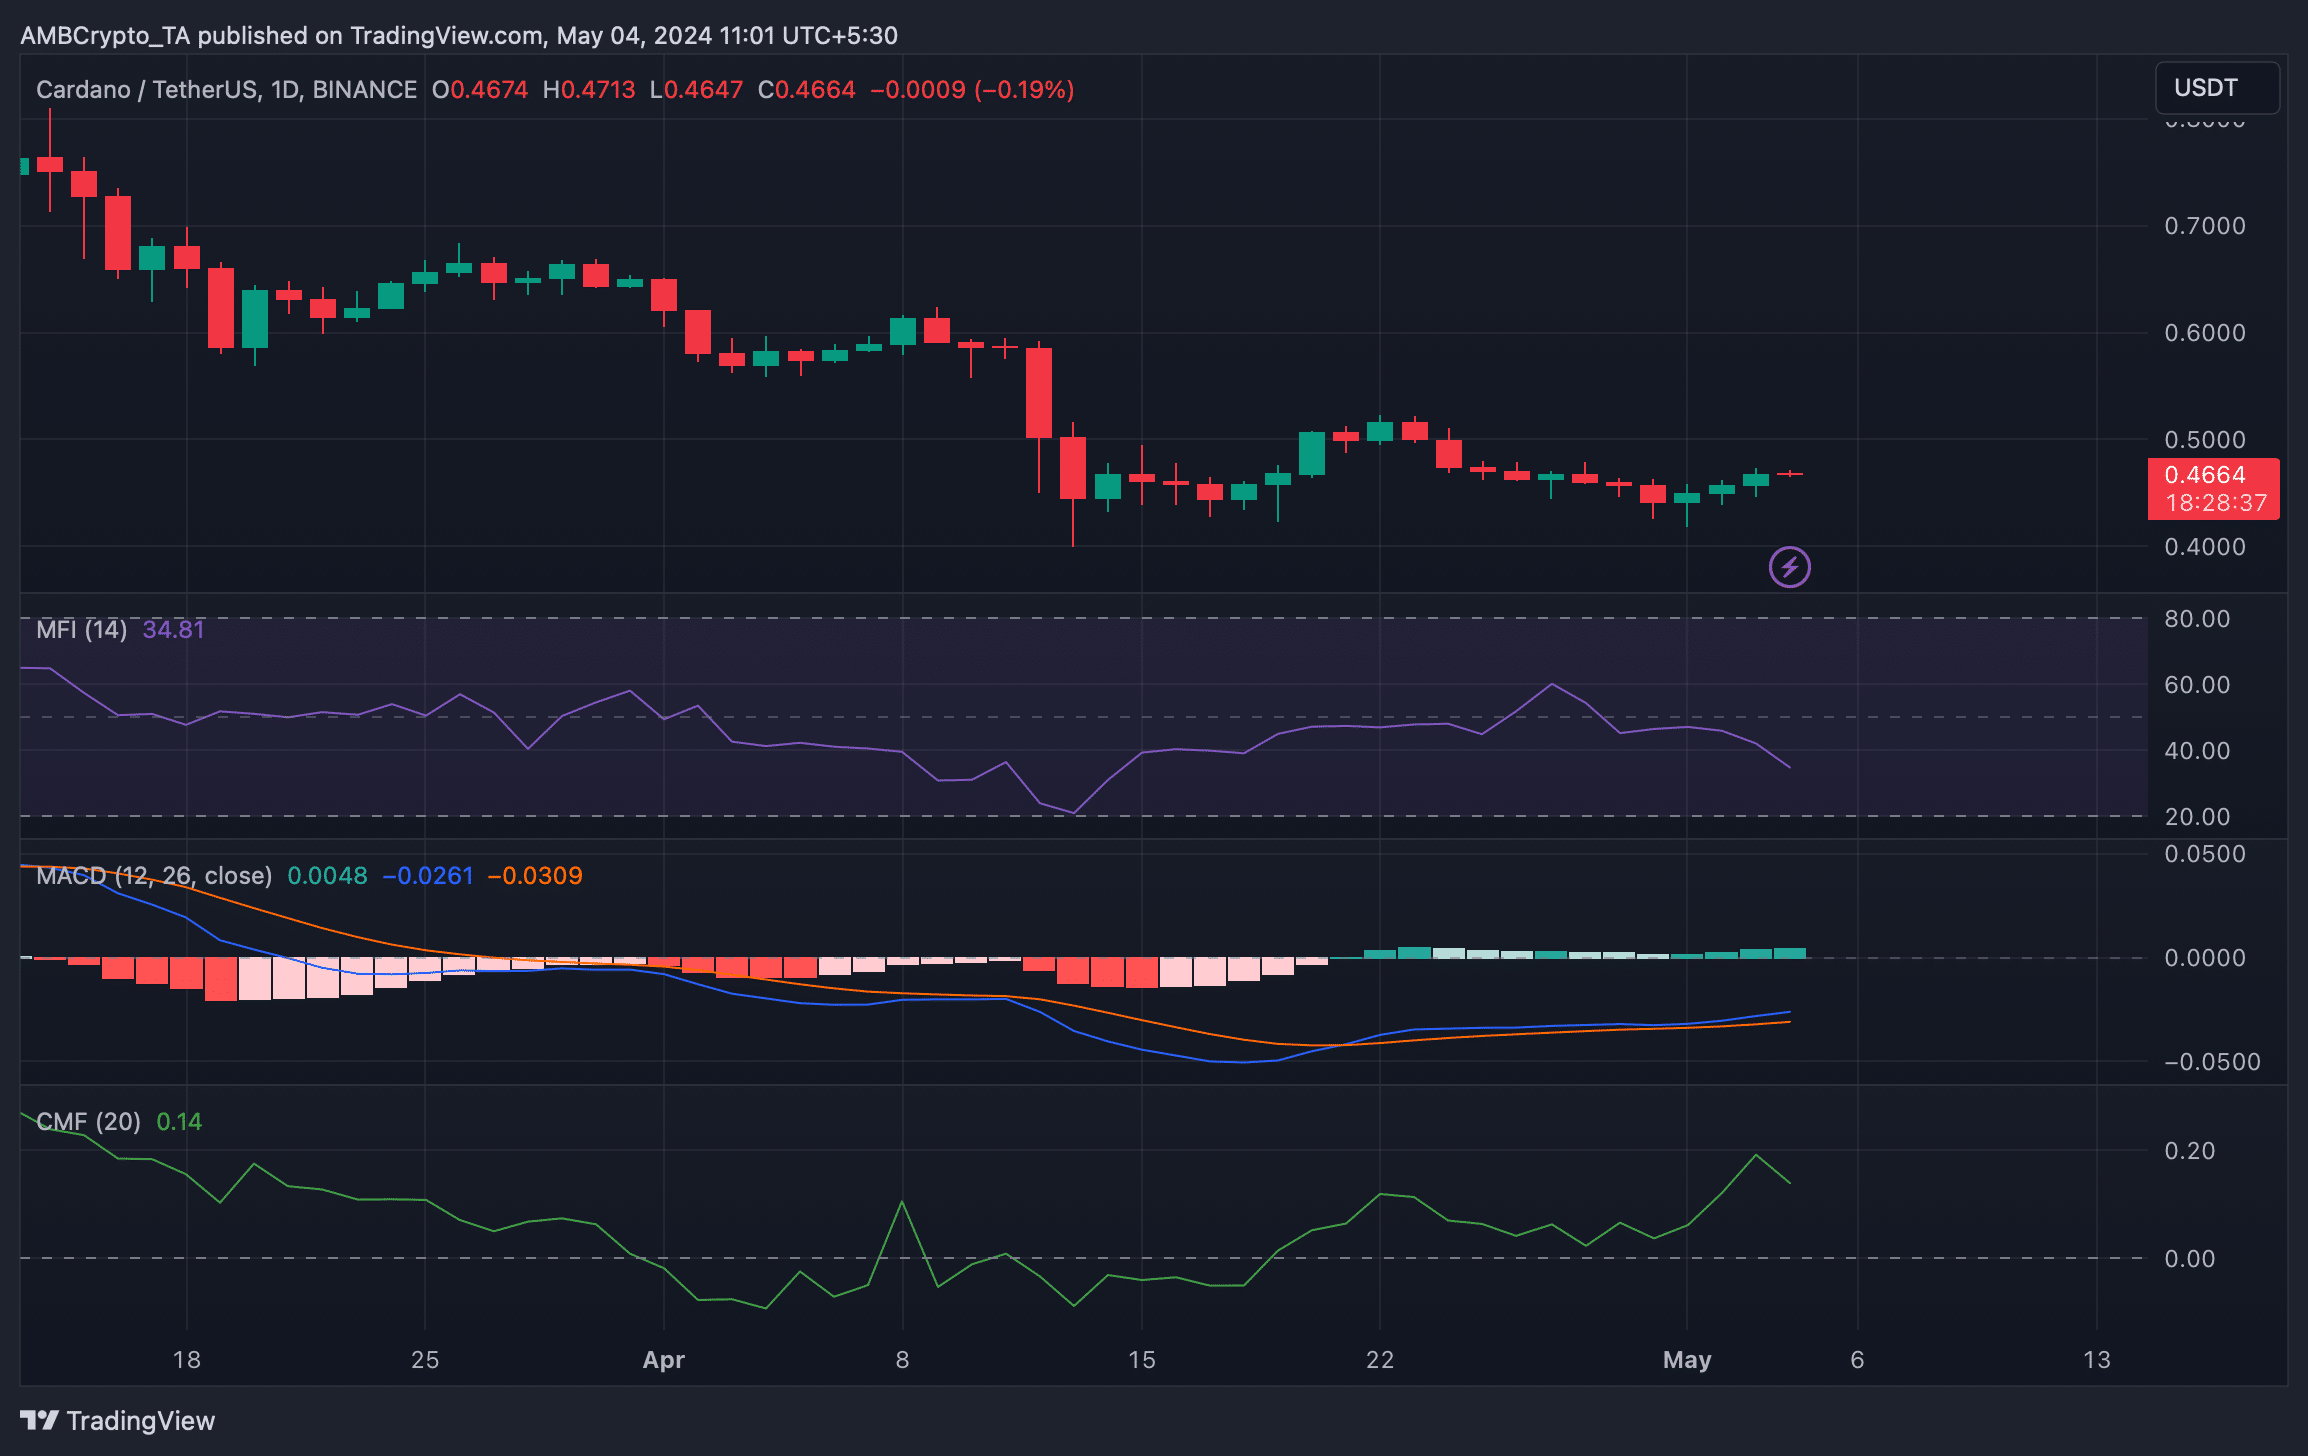
TradingView
rnrn