XRP Price Action Over the Weekend – Why the Breakdown of Long-Term Ranges Could Be Decisive!

Journalist
- Market structure on the higher timeframes was bearish, but XRP could see gains in the coming days or weeks
- Liquidation levels chart shows two short-term price objectives before the next downward move.
XRP’s whale cohort has grown over the past two weeks, suggesting accumulation. AskFX’s recent report also noted an increase in dormant circulation, suggesting selling pressure is likely.
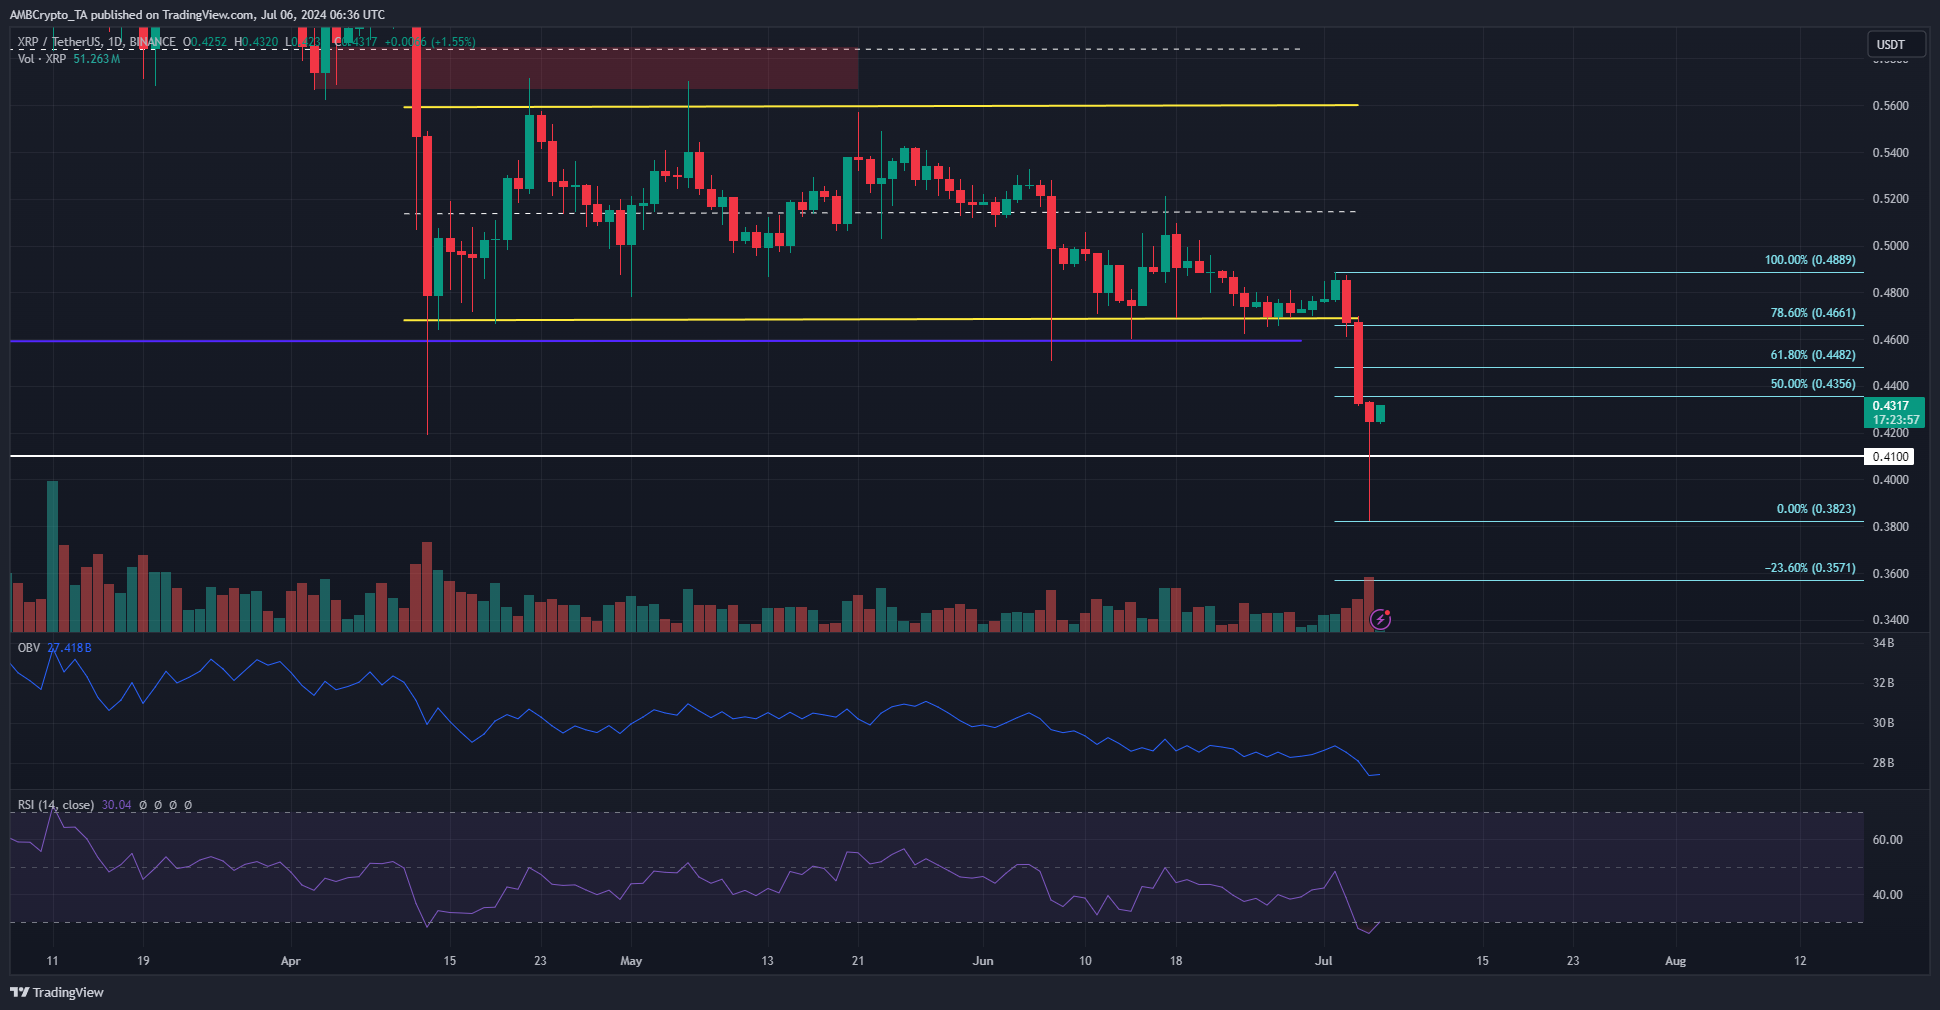
XRP fell to $0.382 but recovered to $0.43 over the past 24 hours. At press time, price action on higher timeframes remained bearish. Liquidity charts on the lower timeframes suggested further price gains were possible.
Here are some things XRP traders should keep in mind –
XRP price analysis
Source: TradingView – XRP/USDT
The 11-month low range where XRP has been trading since August 2023 is highlighted in purple. The smaller range that has been in play since April has also been breached. The bears are stubborn and more losses are expected as the bulls are exhausted.
Fibonacci levels showed that the next target for the bears was the 23.6% extension at $0.357. At press time, the 50% level was at $0.435 and acting as resistance. Short sellers should look for trades between $0.448 and 0.466.
The OBV continues to decline, indicating steady selling volume in the market. The daily RSI hit 30 to indicate oversold conditions. The oversold region does not always guarantee a price recovery, but traders should still be cautious.
Key indicators for potential price increase
AskFX analyzed the data and found that the delta of the overall levels was negative. Simply put, the shorts outweigh the longs and this could lead to a price increase to address key liquidity clusters.
Read Ripple’s [XRP] Price Prediction for 2024-25
If XRP hits $0.461, there are also large leveraged short positions that will be liquidated. There would be a large number of short positions liquidated if XRP hits $0.461.
The $0.47 level was also just above the 78.6% retracement level at $0.466, which reinforced the idea of a negative reversal on the charts.
Disclaimer: This information is not intended to be a source of financial, investment, trading or other advice. It represents solely the opinion of the author.


